Is Bitcoin’s Break Below $100k a Short Capitulation or the Start of a Multi-Quarter Correction?
Summary
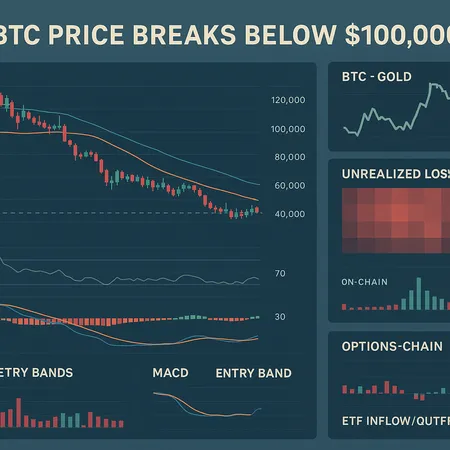
Executive snapshot
Bitcoin’s breach below $100,000 poses a classic portfolio question: buy the dip, hedge, or stand aside? Institutional voices such as JPMorgan have read historical BTC-to-gold relationships as bottom signals, while some technical and on-chain metrics point toward deeper pain among recent buyers. At the same time, derivatives desks and options markets are pricing risk differently than spot traders. Below I unpack the evidence, outline plausible timelines (from weeks to multi-quarter), and offer a practical playbook with entry bands, risk sizing and hedging options for intermediate investors.
The BTC-to-gold signal and the JPMorgan view
JPMorgan’s recent commentary—reported in Forbes—argues that a historical BTC-to-gold relationship can mark cycle troughs, effectively framing Bitcoin as a nascent store-of-value that periodically re-prices against gold. The bank’s take is bullish on the longer-term structural case: if this signal is valid, a capitulation into a localized bottom becomes more likely than an extended multi-year bear market.
Market analysts have echoed similar timing windows. FXEmpire described this same rare BTC-to-gold signal as possibly delimiting a cycle bottom and suggested a 4–12 week consolidation horizon for price discovery after a capitulation phase. That’s a useful short-term framework: if price action and liquidity metrics stabilize within that window, the ‘capitulation’ thesis gains credibility. See the FXEmpire write-up here: a rare BTC-to-gold signal could mark the cycle bottom.
However, caution is warranted: alternative research and market commentary emphasize that macro and liquidity regimes can stretch corrections. NewsBTC outlines a scenario where the BTC correction could persist into mid-2026, which would be consistent with previous multi-quarter unwind phases when credit or macro shocks compounded selling pressure. That longer-horizon possibility must be part of any institutional thinking: correction could last till mid-2026.
On-chain pain: who’s actually underwater?
One of the starkest datapoints today comes from on-chain analytics: CryptoSlate, referencing Glassnode-derived metrics, reports that nearly 99% of BTC investors who accumulated in the past ~155 days are currently holding at a loss. That concentration of unrealized losses among recent buyers is a meaningful liquidity overhang—holders in pain are more likely to capitulate if price action triggers stop-loss cascades or margin liquidations.
That kind of on-chain “buyer pain” implies three things: first, short-term selling pressure can persist even absent fresh macro shocks; second, accumulation from new entrants is constrained while unrealized losses dominate; third, any recovery will need to flush or absorb this latent sell-side pressure. The CryptoSlate piece is worth reviewing for the raw numbers: nearly 99% of recent BTC accumulators are holding at a loss.
Technicals, derivatives and options: what the market is positioning for
Technically, the break below a round number like $100k tends to trigger layers of stop-losses and automated selling. Key moving average and previous-cycle support levels will be watched closely; if those fail, momentum selling accelerates. But beyond spot TA, the derivatives market offers a cleaner picture of risk appetite.
Options desks are currently seeing elevated demand for downside protection—buying puts and skewing implied volatility higher on left-tail risk—while large directional call buying is more selective and often short-dated. That pattern is typical when institutions seek to hedge a core exposure rather than speculative long gamma; it signals concern rather than unalloyed bullish conviction. Perpetual futures funding rates have periodically gone negative in similar selloffs, incentivizing shorts and compressing leverage for longs; watch funding as a contrarian indicator.
Open interest and liquidations tell a story, too: a short squeeze can occur if leveraged shorts dominate, but if the majority of leverage sits in long positions from late entrants (consistent with the on-chain pain data), liquidations could amplify downward momentum. Options metrics such as put-call ratio, skew and concentrated strikes are worth monitoring—large put walls at certain strikes can create technical floors or act as a magnet if they’re sold to generate premium by more sophisticated counterparties.
ETF flows and institutional context
ETFs remain central to institutional price discovery. Flows into spot BTC ETFs over recent months have been uneven: some days show inflows that signal renewed institutional appetite, while others show outflows or muted demand as managers rebalance risk. JPMorgan’s note and coverage in Forbes implied that institutional investors are weighing Bitcoin as an allocation against gold, but timing and scale vary.
For allocators, ETF flows act as a tide: steady inflows can buoy price even amid retail pain; conversely, outflows or idiosyncratic rebalancing by large funds can expose thin liquidity windows. Use ETF flow reports as a confirming indicator, not the sole signal. The Forbes article on JPMorgan’s macro framing is a useful read for the institutional lens: JPMorgan called the bitcoin price bottom and outlined gold comparisons.
Two plausible timelines (and what each implies)
Short-term capitulation (4–12 weeks): Supported by the FXEmpire timing window, this scenario assumes liquidity dries up, sellers exhaust themselves, and institutional buyers step in to accumulate below perceived value. In this case, consolidation and range trading set the stage for higher highs over the subsequent 6–12 months.
Multi-quarter correction (into mid-2026): Echoing the NewsBTC caution, this scenario is driven by persistent macro headwinds or continued on-chain capitulation among recent buyers. Price grinds lower in stages, punctuated by relief rallies, and accumulation is staggered across months or quarters.
Both scenarios can coexist for different investor cohorts: traders may front-run a short capitulation while longer-term allocators prepare to scale in across multiple bands assuming the latter timeline.
Practical playbook: entry bands, risk sizing and hedges
This playbook targets intermediate investors and portfolio managers who want actionable structure.
Position-sizing rubric
- Define crypto allocation as a percentage of total risk capital first (example: 2–8% depending on risk tolerance). Treat any BTC allocation as a layered bucket, not a single trade.
- For each entry band below your reference price (e.g., $100k), predefine tranche sizes: 20% of the target crypto allocation at the first band, 30% at the second, 50% reserved for deep drawdowns. That keeps you from buying the top of a multi-quarter correction.
Recommended entry bands (example framework)
- Band A — Shallow dip / consolidation: ~90–100% of the reference price (e.g., 90–100k if your reference is $100k). Open a small starter position (10–20% of target crypto allocation).
- Band B — Tactical accumulation: ~70–90% of the reference price. Increase allocation (add 20–40% of target allocation).
- Band C — Opportunistic value zone: ~50–70% of the reference. Add larger tranches (30–40% of target allocation).
- Band D — Deep-crisis buying: <50% of the reference. Reserved for longest-horizon, conviction buys (remaining allocation).
Adjust band ranges to your reference levels and invest policies—these are percent-based to remain applicable across price regimes.
Hedging and derivatives tactics
- Protective puts: Buy puts to cap downside for a portion of your position (use longer-dated options to avoid constant roll costs). Costly but precise.
- Collar: Sell out-of-the-money calls against purchased puts to finance protection if you’re willing to cap upside.
- Short/Inverse exposure: Use sparingly and size tightly—shorts can bleed in sudden squeezes.
- Options-based income: Sell covered calls on small/tranche holdings if you’re income-oriented and can accept capped upside.
Scenario plans
- If the short capitulation view wins (4–12 weeks): add according to Bands A→B, reduce hedges gradually, and trim into rallies for rebalancing. Take profits into ETH or DeFi exposure if you want to diversify within crypto.
- If the multi-quarter correction materializes: slow your additions, rely more on dollar-cost averaging across Bands B→D, maintain some hedges (puts or collared structures), and keep dry powder for opportunistic buys.
Execution discipline and monitoring
Set rules for rebalancing and stop-losses relative to your allocation policy. Monitor these key indicators weekly:
- On-chain stress (realized vs unrealized losses among recent buyers).
- Options skew and put-call ratio.
- ETF inflows/outflows and large institutional announcements.
- Funding rates and concentrated perpetual open interest.
Also watch cross-asset signals—if BTC’s relationship with gold continues to behave as JPMorgan suggests, that could be a thematic input for longer-term allocation decisions.
Final thoughts: balance conviction with humility
The current break below $100k sits at the intersection of two credible stories: a short, brutal capitulation that sets a bottom within weeks, or a drawn-out correction that tests patient allocators across quarters. The evidence is mixed: historical BTC-to-gold signals and some institutional takes support a nearer-term bottom, while on-chain pain and the potential for extended macro stress leave room for a longer unwind.
For intermediate investors and PMs, the pragmatic path is to prepare a tiered accumulation plan, keep risk sizing disciplined, and use options or collars to manage tail risk rather than trying to time a single entry. Monitor the real-time signals—on-chain pain metrics, options skew, funding rates and ETF flows—and adapt the playbook as the market clarifies. Platforms like Bitlet.app can be part of the execution toolkit for staged accumulation and dollar-cost strategies, but the core decision remains: are you positioning for a likely capitulation bounce or preparing to dollar-cost into a multi-quarter correction? Either approach can be defensible if executed with pre-defined rules and risk limits.
Sources referenced: JPMorgan/Forbes coverage on BTC-to-gold and bottoms, FXEmpire’s 4–12 week consolidation framing, NewsBTC’s mid-2026 correction scenario and CryptoSlate’s on-chain loss data: Forbes, FXEmpire, NewsBTC, CryptoSlate.
For further reading on asset correlations and trade mechanics for BTC and ETH, track the Bitcoin and ETH feeds for live coverage and deskside analysis.


