Why Bitcoin Plunged Below $100K in Nov 2025 — Capitulation or Structural Shift?
Summary
Executive snapshot
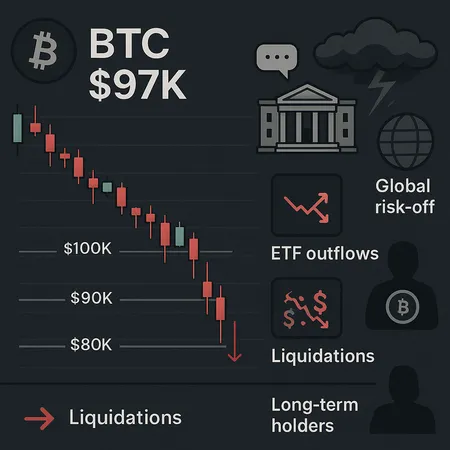
Bitcoin’s mid‑November plunge through the $100,000 mark was not a single cause event — it was the convergence of quick, mechanical forces and broader macro positioning. Within 24–72 hours we saw: large net outflows from U.S. spot BTC ETFs, on‑chain evidence of long‑term holder (LTH) selling, and a cascade of liquidations that amplified the move to a $97k print. This note lays out a timeline, technical map, the key fundamental drivers, and concrete tradeable scenarios for the next 2–6 weeks.
Timeline: from recent highs to the $97k print
Early November — Bitcoin had been trading in a multi‑week elevated range above the $100k psychological level after a bullish run earlier in the season. That range hardened trader positioning and increased leverage.
Mid‑November initial shock — A sudden increase in selling pressure intersected with heavy concentrated leverage on the long side. Within hours, exchanges reported a large block of long positions liquidated, accelerating the downside.
The $100k break and cascade — As the round number failed, stop‑hunts and margin calls pushed price through nearby supports; the market printed near $97k before a volatile intraday bounce.
Contemporaneous coverage captured the flows and liquidations: mainstream reporting documented the drop below $100k and noted it was the lowest since May (Forbes). On the ETF front, U.S. spot Bitcoin funds recorded one of their largest single‑day outflows — roughly $869.86M — which removed a critical demand pillar just as the market weakened (CoinDesk ETF flows).
Technical map and the liquidation mechanics
Key price levels to watch (short term)
- Immediate: $100,000 (psychological round; now resistance)
- Near support cluster: $95,000 — a short‑term liquidity pocket where stair‑step bids often sit
- Secondary: $88,000–$92,000 — prior consolidation zone and likely magnet if weakness continues
- Structural buffer: ~ $80,000–$85,000 — where many protocols and longer MA horizons tend to converge in a sell cycle
These levels aren’t precise oracle lines; think of them as decision zones where stop orders, margin calls, and limit bids aggregate. The most important takeaway: the break of $100k turned a psychological floor into resistance and sent algorithmic liquidity hunting for the next bid concentrations.
Liquidation cascade explained
Liquidation cascades happen when leveraged long positions are forcibly closed, creating market orders that feed further price declines. CoinDesk reported roughly $880M in bullish bets liquidated in the same session the price fell under $98k — a material chunk of open interest removed almost instantly (CoinDesk liquidations).
Mechanically, the cascade amplified the move through three mutually reinforcing channels:
- Market sell pressure from forced liquidations;
- Voluntary selling by LTHs and institutions taking profits or cutting exposure; and
- Margin and funding rate feedback loops that pushed more participants to reduce risk.
On‑chain analysis and reporting indicated that long‑term holders were indeed moving coins into exchanges and selling, consistent with profit‑taking and rebalancing behavior after a prior rally (NewsBTC on LTH selling).
Fundamental drivers: ETF outflows, long‑term holders and macro risk
ETF outflows — evaporating a demand floor
Spot BTC ETFs were a structural buyer narrative for months. Suddenly, when $869.86M left U.S. spot BTC ETFs in the recent session, a key marginal buyer withdrew, leaving sellers searching for counter‑party demand in a thinner market (CoinDesk ETF flows). For active managers and systematic desks that use ETF flows to anchor execution algorithms, that withdrawal both reduced direct buy pressure and signaled to other institutions to reduce exposures.
Long‑term holders and institutional profit‑taking
Long‑term holders — historically a stabilizing cohort — began distributing into strength. On‑chain evidence suggests an uptick in LTH exchange inflows prior to and during the drawdown, consistent with profit taking and tactical rebalancing. That behavior matters: when LTHs shift to sellers, the implicit long‑term bid shrinks, and liquidity is more tenuous.
Macro crosswinds: Fed commentary and global risk‑off
The selloff happened against a backdrop of renewed macro uncertainty. Hawkish Fed commentary and broader risk‑off positioning tightened correlations between risk assets; investors reduced levered exposure across equities and crypto. In these moments, cross‑asset liquidity dries up: dealers widen markets, options skews move, and stop clusters become more expensive to trade through. Analysts catalogued multiple reasons the crash intensified, including positioning, macro, and liquidity dynamics (Invezz analysis).
Tradeable scenarios for the next 2–6 weeks (practical playbook)
Below are three scenarios with pragmatic trade ideas, risk guidelines and probability weights for the coming 2–6 week window. These are not investment advice but tactical frameworks for intermediate traders and portfolio managers.
Scenario A — Short‑term capitulation and mean reversion (40% probability)
Thesis: The move near $97k completes a liquidity washout; dealers buy the panic and spot ETFs stabilize, leading to a relief rally back above $100k.
Signals to watch:
- ETF flow stabilization or re‑inflows within 3–10 days (CoinDesk ETF flows).
- Rapid decline in realized liquidations and shrinking negative funding rates.
- On‑chain netflows from exchanges turning negative (coin outflows).
Tactical ideas:
- Layered mean‑reversion longs between $95k and $90k, size for 1–2% of allocation with tight stops (5–7%) if price breaks below $88k.
- Options: buy call spreads (30–45 delta) 4–6 week expiries as a cheaper way to express asymmetric upside.
Risk: A failed bounce can turn these positions into stop hunts; keep sizes small and use options to limit downside.
Scenario B — Deeper structural reprice (35% probability)
Thesis: ETF outflows persist, LTH selling continues, and macro risk‑off pushes BTC toward the $80k band over several weeks.
Signals to watch:
- Continued large ETF outflows and steady LTH exchange inflows.
- Failure to reclaim $100k within 7–10 trading days.
Tactical ideas:
- Tactical shorts on meaningful rallies into $100k–$105k with tight risk controls for horizon trades (2–4 weeks).
- Buy put spreads targeting $85k–$80k for protection of larger BTC holdings.
- Pair trades: hedge directional exposure by shorting correlated risk assets or using inverse BTC ETFs/derivatives where available.
Risk: Short squeezes from abrupt dealer buying can be violent. Keep leverage moderate and watch funding rates.
Scenario C — Range and structural digestion (25% probability)
Thesis: Market enters a multi‑week consolidation as buyers and sellers rebalance; BTC trades between $88k and $110k while participants de‑risk.
Signals to watch:
- Oscillatory ETF flows (small inflows/outflows) and neutral on‑chain exchange flows.
- Volatility drops from liquidation levels; realized vol converges to multi‑week mean.
Tactical ideas:
- Volatility selling strategies (iron condors, short strangles) sized conservatively against gamma risk.
- Buy dips with clear sell disciplines at the top of the range; use calendar spreads to monetize time decay.
Risk: Unexpected macro shocks or renewed liquidation waves can blow out short volatility positions.
Risk management, sizing and execution tips
- Size first, trade second: Given the presence of forced flows, adopt smaller initial sizes and scale only into confirmed structural signals.
- Use options to define downside and avoid naked directional exposure in elevated volatility regimes.
- Watch funding rates and open interest as early warnings of building leverage — sudden spikes often precede fresh liquidation events.
- For portfolio managers, consider overlay hedges (puts, futures shorts, tail protection) rather than liquidating core long positions if your investment thesis is multi‑year.
Closing thoughts — capitulation, not necessarily apocalypse
The mid‑November drop under $100k was a high‑velocity event born from the interaction of ETF outflows, LTH selling, and a mechanically driven liquidation cascade against a tense macro backdrop. The evidence suggests a plausible short‑term capitulation — a washout that could invite dip buyers — but the door is open to a larger reprice if ETF demand stays weak, long holders continue to distribute, and macro risk persists. Monitor ETF flows, on‑chain exchange inflows, funding rates and the $88k–$95k decision zone closely.
For traders working across execution venues, platforms like Bitlet.app can be useful for managing staggered entries and hedges, but keep execution discipline and risk limits front and center.
Internal resources for ongoing coverage: Bitcoin and ETFs.
References
- Forbes — Bitcoin prices plunge below $100,000 (Nov 14, 2025): https://www.forbes.com/sites/digital-assets/2025/11/14/bitcoin-prices-plunge-below-100000-to-reach-lowest-since-may/
- CoinDesk — $869.86M ETF outflows (Nov 14, 2025): https://www.coindesk.com/markets/2025/11/14/bitcoin-spot-etfs-see-usd869m-outflow-second-largest-on-record
- CoinDesk — $880M in bullish bets liquidated (Nov 14, 2025): https://www.coindesk.com/markets/2025/11/14/bitcoin-plunges-under-usd98-000-eth-sol-ada-down-8-as-usd880m-in-bullish-bets-liquidated
- NewsBTC — On‑chain LTH selling evidence: https://www.newsbtc.com/bitcoin-news/bitcoin-selling-accelerates-btc-holds-100000/
- Invezz — Analysis on intensifying crash drivers: https://invezz.com/news/2025/11/14/top-reasons-why-the-bitcoin-price-crash-is-intensifying/?utm_source=snapi