Why Crypto Sentiment Has Plunged to Seven-Month Lows While Bitcoin Sits Above $100K — What It Means for Near-Term Price Risk
Summary
Quick take
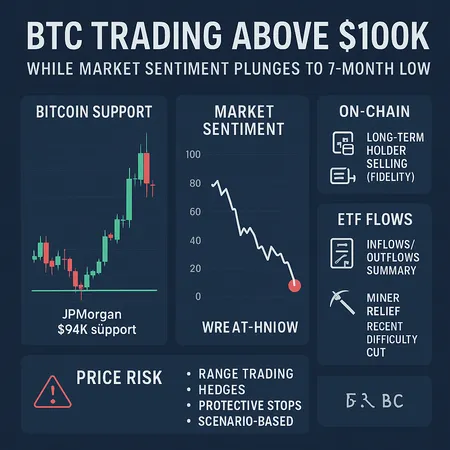
Sentiment indicators — from fund-manager surveys to options skew and social metrics — have dropped to the lowest levels in seven months even as Bitcoin trades above $100,000. That paradox matters: price strength with deteriorating sentiment raises the probability that any macro shock or flow imbalance will translate into a sharp, short-lived correction rather than a calm consolidation. This note walks through the macro drivers, JPMorgan’s $94k support thesis and its implications, Fidelity’s on-chain warnings about long-term holder selling, how ETF flows and a recent miner difficulty cut interact, and pragmatic trading strategies for a sideways-to-bearish environment.
Why sentiment has plunged: the macro triggers
Sentiment rarely moves in isolation. The recent deterioration reflects a cluster of macro forces that collectively tilt risk assets toward caution:
- Interest-rate volatility and sticky inflation data have kept real yields elevated. Rising yields make riskier assets less attractive and raise the hurdle rate for crypto as an uncorrelated or inflation-hedge asset.
- A firmer U.S. dollar amplifies this effect. When USD strength accelerates, dollar-denominated BTC requires more local purchasing power to sustain inflows.
- Equities and risk-parity flows have weakened: equity drawdowns and higher implied correlations mean many systematic strategies are reducing leverage and risk exposure across asset classes, including crypto.
- News flow and geopolitical headlines create episodic spikes in risk aversion; in a fragile sentiment backdrop, these headlines have outsized impact on price action.
Put together, these macro inputs have pushed traders to de-risk. Options implied vol and put-call skew have widened, and social and fund-manager sentiment surveys moved to multi-month lows. That’s a warning light: even if BTC remains technically strong, the buyer base is more tentative and less willing to absorb large, sudden sell pressure.
JPMorgan’s $94k support — what it really implies
JPMorgan’s $94k designation has been interpreted as a floor; it’s better read as a conditional support level derived from liquidity, historical pullback bands, and likely market-maker hedging assumptions. At current levels above $100k, a drop to $94k implies a roughly mid-single-digit percentage pullback. That magnitude is not catastrophic, but in the current sentiment regime it could be meaningful for several reasons:
- A move to $94k may trigger momentum-based stop orders and trip short-term liquidations if leverage is still elevated in derivative books.
- Institutional programmatic flows — especially from ETFs and liquidity providers — can flip behavior at that level: arbitrage desks might sell into weakness if creation/redemption dynamics are stressed.
- A test of $94k would update risk models and could shift implied-volatility surfaces higher, increasing hedging costs for market-makers and reducing natural liquidity.
So JPMorgan’s level should be treated as a plausible near-term downside case rather than a hard lid. If sentiment is already weak, the path below $100k can be faster and deeper than simple percentage math suggests. Conversely, failure to break $94k quickly would reduce immediate tail risk and could attract contrarian buying.
On-chain signals: Fidelity flags long-term holder selling and why it matters
On-chain analytics are noisy, but trends are actionable when several indicators align. Fidelity’s recent communication highlighted elevated long-term holder (LTH) selling activity and increased realized cap, which point to supply leaving historically illiquid hands. Key implications:
- LTH selling reduces the typical “supply lock-up” that has supported rallies in past cycles. When holders who previously ignored short-term volatility begin to sell, the market’s depth to absorb large withdrawals drops.
- Metrics like net exchange inflows, the spent output profit ratio (SOPR), and a rising realized cap typically precede periods of distribution. If realized cap increases meaningfully, it suggests coins are changing hands at higher cost bases — sellers are crystallizing gains.
- Exchange inflows (if increasing) and diminishing HODLer dominance raise the risk that spot supply will meet persistent outflows from miners or ETF-related arbitrage desks, amplifying downside pressure.
In short: increased LTH selling makes price action less resilient. Traders should monitor LTH supply metrics, exchange balances, and SOPR as leading indicators of whether a dip could morph into distribution rather than accumulation.
ETF flows and miner difficulty cut — offsetting forces
ETF flows, arbitrage, and miners are the plumbing of the market; they can either drown sentiment or provide support.
- ETF flows: Primary-market ETF flows (creations/redemptions) and secondary-market capital movement are critical. Strong sustained inflows have been a structural bid, but flows can reverse quickly. Importantly, ETF-related arbitrage can create two-way pressure: when ETFs buy spot, there’s upward price pressure; when redemptions occur, authorized participants may sell into the spot market or redeem inventory, creating supply. Monitoring daily creation/redemption prints and AUM velocity is essential.
- Miner difficulty cut: The recent network difficulty reduction provided miners immediate operational relief. Practically, a cut can increase short-term miner revenue per unit of hashpower and lengthen the time between required sales to cover costs, reducing the urgency to sell newly mined BTC. That eases one persistent source of sell-side pressure.
These forces compete. A difficulty cut reduces structural selling from miners, while LTH selling and potential ETF redemptions can add supply. In a weak sentiment context, even miner relief may not be enough to prevent price tests unless ETF flows are net positive or retail/institutional demand steps back in.
(For more on core market dynamics see Bitcoin and how investors track inflows via ETFs like those discussed under ETFs.)
Near-term price-risk scenarios (practical framing)
Frame risk as scenarios with triggers and implied probabilities given the current sentiment backdrop:
- Base (40%): Range-bound consolidation between ~94k–106k for the next 2–6 weeks. Weak sentiment limits upside; miner relief and some ETF demand cap downside. Volatility normalizes but skew remains elevated.
- Bearish (35%): Break below $94k after a macro risk shock (worse-than-expected CPI, US rates spike, or sizable ETF redemptions). This path could see rapid stop-fueled moves to lower structural supports and higher realized volatility.
- Bullish (25%): Sentiment stabilizes as ETF inflows resume and LTH selling peters out; BTC revisits new highs. This is the least likely near term given current metrics but remains possible if a liquidity wave re-enters the market.
Assign probabilities relative to the current data; update them as on-chain flows, ETF prints, and macro data print.
Trading and risk-management strategies for sideways-to-bearish conditions
Actionable tactics for intermediate traders and PMs who want to navigate the current regime:
Positioning and sizing
- Reduce directional exposure and leverage. If your model expects >10% drawdowns under stressed scenarios, scale back leverage or size accordingly. Smaller position sizes reduce path dependency risk.
- Use staggered entries rather than large one-shot buys; the case for dollar-cost averaging is stronger when sentiment is fragile.
Options and structured hedges
- Buy protective wings: Put spreads (bear put spreads) are cost-efficient for hedging a defined downside while limiting premium spend. For example, buying 2–5% out-of-the-money puts while selling deeper OTM puts can lower cost.
- Collars on large spot positions: Sell covered calls to fund puts; this reduces cost of protection if you’re neutral-to-bearish.
- Calendar and variance trades: If you expect elevated near-term vol, consider selling longer-dated implied volatility while buying short-dated vega, but only if you are sophisticated about margin and gamma risk.
Cash/spot hedges and pair trades
- Increase cash buffer or stablecoin allocation to deploy into dips. That preserves optionality.
- Consider pairs trades (e.g., reducing exposure to high-beta altcoins and increasing relative BTC cash), which reduce portfolio volatility while keeping market participation.
Tactical entries and stops
- Treat $94k as a reference — not an absolute stop. Many traders place protective actions slightly below key support to avoid noise-driven exits. For managers, a stepped stop approach with re-evaluation points makes sense.
- For active traders, put-call skew and open interest shifts can signal when market-makers need to buy or sell hedges; use flow data to guide intraday bias.
Monitor the right metrics
- On-chain: exchange inflows, LTH supply trends, SOPR, realized cap.
- Flows: ETF creations/redemptions and AUM deltas, secondary-market ETF flow patterns.
- Macro: USD index, U.S. real yields, and equity correlation measures.
Practical checklist for portfolio managers (five quick items)
- Reassess stopping rules and worst-case drawdown limits given weaker sentiment.
- Size hedges to protect against a 6–15% drawdown depending on your risk tolerance.
- Monitor daily ETF creation/redemption prints and exchange flow dashboards.
- Watch for clustering of LTH selling on-chain; if sustained, raise cash allocation.
- Use miner metrics and difficulty adjustments as a contrarian gauge: miner relief reduces constant sell pressure and can be a stabilizer.
Closing thought
A disconnect between bullish price action and deteriorating sentiment is a classic early warning sign. Above $100k, BTC looks strong on the chart, but weak sentiment and rising on-chain selling increase the odds of a sharp, short-lived correction in response to a macro surprise or flow reversal. Traders and managers should tilt toward risk control: protect the downside with cost-efficient hedges, reduce directional leverage, and keep a close eye on ETF flows and LTH supply metrics. For those building longer-term entry plans, volatility creates opportunity — but only for the patient and well-hedged.
Note: for platforms offering installment and earn features, including portfolio-level liquidity planning, consider how products like Bitlet.app affect your ability to deploy into dips without forced sales.


