Trading Solana: ETF Flows, Network Revenue, and Tactical Trade Plans
Summary
Executive snapshot
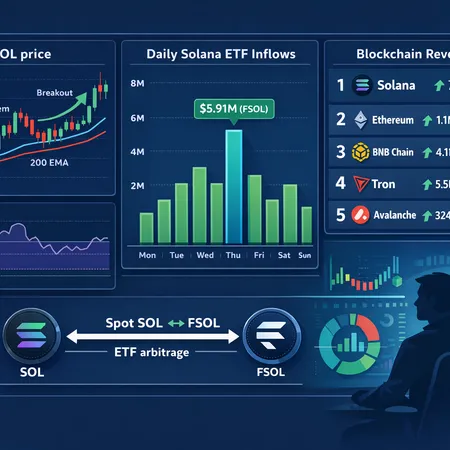
FSOL led Solana ETF flows with $5.91M of inflows on the most recent daily print — a straightforward liquidity datapoint that matters because ETFs are one of the cleaner on-ramps for institutional capital. At the same time, independent reporting shows Solana topping weekly blockchain revenue and a market note points to a bullish short-term technical setup and a $145 breakout focus. Together, these three signals — ETF demand, network revenue, and technical momentum — form the core thesis for a tradeable Solana view. This guide translates those signals into a practical playbook for traders and allocators.
ETF flows snapshot: FSOL leading the charge
The clearest near-term catalyst was ETF activity: daily flow data shows FSOL leading Solana ETF inflows with $5.91M on the most recent day. That level of demand concentrated in a single product is important because ETFs route a concentrated and often recurring source of buy-side pressure into listed markets. See the flow report for context: Blockonomi's daily ETF update.
Why flows matter to traders: ETFs create a direct trading bridge between institutional cash and spot/futures liquidity. Authorized participants (APs) can create shares by delivering SOL or redeem shares for SOL — that mechanism can either supply or remove spot liquidity depending on net flows. When net creations are positive and sustained, ETFs effectively add demand to the market; when redemptions kick in, that demand can reverse quickly. Add in the fact that many ETF buyers are momentum or allocation-driven, and short-term price moves can amplify.
On-chain fundamentals: revenue leadership and why it supports price
Separately from capital flows, Solana has shown a material fundamental improvement: weekly network revenue spiked, putting Solana at the top among blockchains in reported weekly revenue. That piece of the story was flagged in market coverage highlighting Solana’s revenue breakout and a focus on a $145 technical breakout as a next structural target (Coinpaper report).
Why revenue matters for long-term allocators: rising on-chain revenue usually means stronger fee capture, higher economic activity, and better monetization for protocol participants — all of which improve the narrative that SOL can sustain higher valuation multiples if the revenue trend is durable. For traders, revenue acts as a tailwind behind flows; if fees and usage are growing while ETFs add demand, the market has both fundamental and capital-engine support.
Technical picture: the short-term bullish setup
Independent market analysis indicates a short-term bullish configuration for SOL, noting momentum and potential breakout structures that align with the $145 upside reference mentioned above (Cryptonomist analysis). The practical read: momentum indicators and price structure suggest buyers are in control on intraday-to-weekly timeframes, but the usual caveat applies — technicals can fail if liquidity dries or flows reverse.
For traders, that means adopting setups that respect the trend but plan for drawdowns. A bias toward buying pullbacks into defined support or buying confirmed breakouts keeps the edge while limiting downside exposure.
Will ETF flows sustain SOL price momentum? A balanced assessment
Short answer: possibly — but not guaranteed. Here are the mechanics and scenarios traders should track.
- Mechanical impact: ETFs can add durable demand if creations remain net positive. APs create supply only when they can source SOL cheaply; heavy inflows force APs to buy spot and deliver SOL, pushing spot prices higher. If inflows persist, the effect compounds.
- Liquidity & depth: Solana’s order books and futures liquidity determine how much price moves per dollar of buy pressure. Smaller, concentrated markets can move more per dollar; FSOL’s $5.91M is meaningful but must be viewed relative to daily spot/futures volume.
- Duration of flows: One-day inflow spikes are less durable than weeks of cumulative inflows. Monitor consecutive-day net inflows and ETF AUM growth rather than single prints.
- Counterflows and redemptions: A change in sentiment, options-driven hedging, or big redemptions can accelerate sell-side pressure — especially if leveraged futures positions are long.
- Fundamental support: Rising network revenue improves the odds that positive flows have longer legs because economic activity justifies higher valuations.
Net takeaway: ETF inflows like FSOL’s recent $5.91M create a positive impulse. If inflows are sustained, and on-chain revenue remains strong, there is a reasonable probability the momentum will continue. If flows prove transient, SOL can retrace sharply because crypto markets are still liquidity-sensitive.
ETF arbitrage: what traders and market makers should watch
ETF arbitrage is an informational and execution edge. The core signals are: ETF premium/discount to NAV, creation/redemption notices, and relative basis between spot, ETF, and futures. Practical monitoring checklist:
- Track FSOL ETF NAV vs. market price in real time — persistent premiums indicate demand that APs haven’t arbitraged away.
- Watch basis (spot vs. futures) for elevated contango/backwardation that reveals financing pressure or hedging flows.
- Use order-book depth across major venues to estimate how much SOL an AP would need to source to create shares.
- Monitor creation/redemption filings when available; they often lag flows but are the clearest proof of AP activity.
A basic arbitrage trade (institutional-level): buy spot SOL while shorting an overvalued ETF share if the ETF trades at a premium and you expect APs to create shares; unwind when premium collapses and APs create. Retail traders typically can only observe premiums and trade the implied directional flow (long spot when sustained premium is present), but advanced participants can use futures and options to hedge exposure.
Tactical trade ideas by time horizon
Note: these are structured trading ideas, not investment advice. Adjust position size for account volatility tolerance.
Short-term (intraday to 7 days)
- Strategy: buy pullbacks into intraday support or scalp momentum on confirmed breakout candles.
- Entry: accumulate into defined dip zones near short-term moving-average confluence or on a pullback of 20–40% of the move from the session low to the session high.
- Risk: tight stop (1.5–3% for scalps, 3–7% for intraday swing) depending on volatility. Expect quick whipsaws; prefer small sizing.
- Execution tips: use limit orders to control slippage, and avoid trading immediately after major macro prints that increase cross-market volatility.
Swing (7 days to 3 months)
- Strategy A — Momentum breakout: buy on a clean daily breakout above a confirmed structural level (for some analysts that referenced $145 as a structural breakout target). Scale in and use a trailing stop below higher-timeframe support.
- Strategy B — Flow fade with hedge: if ETF premium is spiking, buy SOL spot and short equivalent notional in futures or buy protective puts to guard against a sudden reversal if flows slow.
- Positioning: 5–15% of risk capital depending on conviction. Use stop loss ~8–20% depending on entry and use partial profit-taking at predefined resistance zones.
Long-term (3+ months)
- Strategy: accumulate via dollar-cost averaging to capture persistent demand themes: ETF adoption + rising network revenue. Consider allocating a portion to staking if you are long-term and want yield while you hold.
- Positioning: treat this as an allocation decision — keep size moderate relative to broader portfolio risk and rebalance as on-chain revenue and ETF adoption evolve.
Options and hedged structures
- Call spreads (buy a nearer-dated call, sell a higher strike) to play continuation while financing part of the premium.
- Protective puts to hedge sizable spot positions during windows of elevated tail risk (e.g., options expiries, major macro events).
- Collar: hold spot SOL, buy OTM put and sell OTM call to reduce cost if you’re willing to cap upside.
Practical ETF-arbitrage trade (conceptual for advanced traders)
- Observe a persistent FSOL premium to NAV and significant net inflows over several days.
- Buy SOL on spot or accumulate via DCA; hedge directional exposure with short futures sized to the spot position.
- If/when APs create shares and premium normalizes, unwind futures hedge and lock in the directional profit or pocket basis change.
This requires access to low-cost execution, capital for margin, and realtime NAV/premium feeds.
Risk management & execution checklist
- Position sizing: limit single-trade risk to a small percent of equity (1–3%) for active trades; larger for low-volatility allocations.
- Volatility buffer: SOL can gap; use stop orders with awareness of slippage and consider options as insurance.
- Liquidity & venue selection: route large orders across venues and use TWAP/VWAP algorithms for large fills to avoid market impact.
- Monitor correlated markets: large moves in Bitcoin and broader risk appetite can flip SOL risk rapidly. Also watch DeFi activity on Solana for usage shocks.
- Taxes/regulation: ETF flows, creations/redemptions, and staking yield can have tax implications; consult your tax advisor.
- Keep an eye on orderbook depth and derivatives open interest — both provide early warnings of potential squeezes.
Quick playbook and watchlist
- Immediate data points to track daily: FSOL net flows, ETF premium/discount, spot & futures volume, exchange order book depth.
- On-chain fundamentals: weekly revenue, transactions per second, active address growth, and fees — rising revenue supports higher valuations.
- Triggers that favor long positions: multi-day net inflows into FSOL, shrinking ETF discount, confirmation of daily breakout above structural resistance, and rising weekly revenue.
- Triggers that favor caution or reduce exposure: sudden net redemptions, ETF premium collapse, sharp decline in on-chain revenue, or major liquidity withdrawal in derivative markets.
Closing thought
FSOL’s recent $5.91M inflow is an actionable data point that, when combined with Solana’s stronger revenue profile and a bullish short-term technical setup, gives traders a credible thesis to position for further upside. The edge comes from marrying flow monitoring with on-chain revenue checks and disciplined risk management. Institutional-style ETF dynamics can accelerate moves, but they can also reverse quickly; treat each trade as a conditional bet and size accordingly.
Sources
- Blockonomi — Solana ETFs market update and daily flows (FSOL $5.91M inflows): https://blockonomi.com/solana-etfs-market-update-fsol-dominates-with-5-91m-inflows-as-other-sol-etfs-hold-stable/
- Cryptonomist — Solana short-term technical/market analysis: https://en.cryptonomist.ch/2026/01/14/solana-crypto-analysis-bullish/
- Coinpaper — Solana becomes weekly revenue leader and $145 breakout focus: https://coinpaper.com/13731/solana-becomes-revenue-king-with-145-breakout-now-in-focus?utm_source=snapi
Note: blend these signals with your own execution plan and platform tools (Bitlet.app users may find the platform’s P2P and liquidity features useful for tactical allocation), and always run the trade through your risk framework before committing capital.