Market Rotation Early 2026: NFTs Crash, Altcoin Flows, and Rules to Safely Increase Alt Exposure
Summary
Executive snapshot
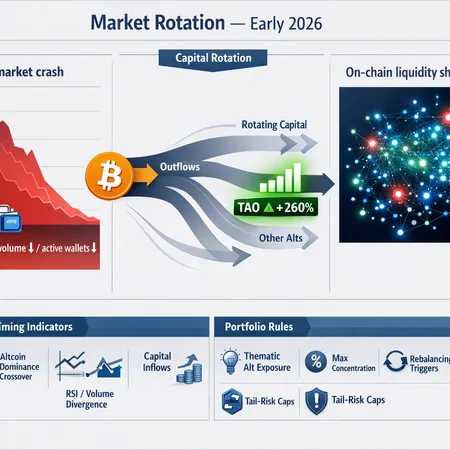
Early 2026 is shaping up as a classic cyclical rotation: NFT market crash metrics and falling participation have coincided with measurable flows into altcoins. For allocators, the question is not just if to increase alt exposure, but when and how to do it without destroying risk budgets. Below I synthesize recent market signals, on-chain liquidity metrics, and a practical rulebook to incrementally express thematic alt exposure — using TAO’s rally as a case study of where concentrated momentum can form.
What the data says: NFT volumes and participation
The most visible early signal is the collapse in NFT economic activity. Reporters documented NFT sales plunging roughly 27% to about $62.5M over the latest reporting period, alongside a sharp collapse in buyer/seller participation and turnover, a sign that speculative capital has withdrawn from that corner of the market (crypto.news).
This matters for allocators because NFTs historically amass marginal risk capital in bull runs; when those flows retrace, liquidity migrates elsewhere. Reduced NFT trading volumes also remove a non-trivial sink for stablecoin liquidity and retail attention — freeing capital to rotate into more liquid, tradable altcoin pockets.
Evidence of capital rotating out of BTC and into alts
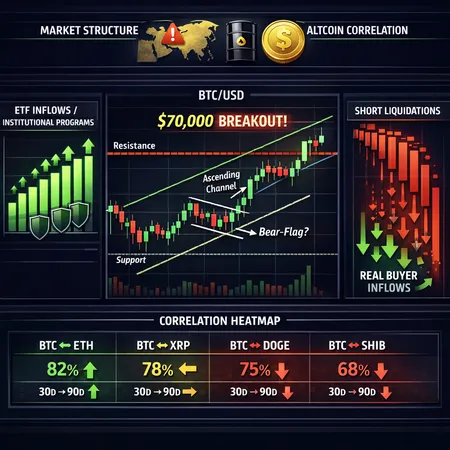
Multiple market measures now support the “altcoin rotation” narrative. Price-flow and narrative analysis point to capital stepping away from Bitcoin (BTC) and into altcoins that show on-chain or fundamental narratives: increased spot demand, rising DEX volumes, and concentrated retail/institutional flows. Coinpedia’s recent analysis highlights capital rotating out of Bitcoin as altcoins gain momentum in early 2026, a pattern consistent with previous altseasons where BTC dominance weakens and smaller-cap tokens outperform (CoinPedia rotation piece).
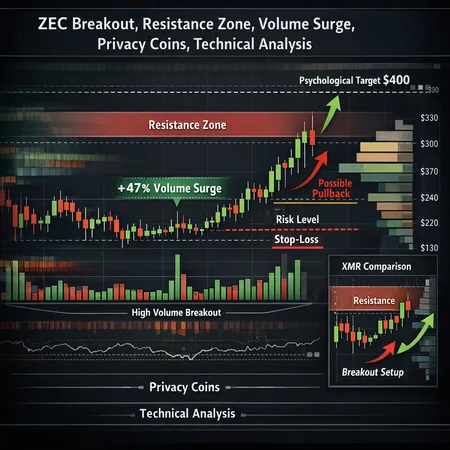
At the security level, TAO (Bittensor) is an instructive micro-case: technical strength and volume have produced a rally that traders have compared to classic breakout patterns. Analysts pointed to TAO’s move and nearby resistance levels as evidence of where alt momentum can concentrate (TAO rally report). Concentrated rallies like TAO’s often precede broader alt participation, but they can also remain isolated if broader liquidity and correlation thresholds aren’t met.
For many allocators, Bitcoin remains the core hedge; rotation into alts should therefore be directional and conditional — not a wholesale abandonment of BTC.
Key on-chain and market indicators to time altseason maturity
Rather than a single trigger, treat altseason maturity as a checklist where multiple signals increase conviction. Below are empirically useful indicators and practical thresholds to watch:
BTC dominance and relative market cap: A sustained decline in BTC dominance of >3–5% over 4 weeks accompanied by the top-100 altcap outperformance versus BTC for 15–30 trading days tends to mark early rotation.
Spot and derivatives flows: Net inflows to altcoin spot markets and a rise in altcoin open interest (OI) relative to BTC OI indicate capital commitment. Look for altcoin OI growth outpacing BTC OI by >15% week-over-week as confirmation.
On-chain liquidity shifts: Increasing ERC-20 transfer volumes, rising DEX swap volumes, or larger stablecoin movement into alt liquidity pools signal usable liquidity. If stablecoin reserves on non-custodial venues rise while NFT activity falls, the marginal liquidity is available for alts.
Concentration of breakouts: One or two large-cap alts performing strongly (e.g., TAO-style rallies) is a start. But altseason tends to mature only when broad-based mid-cap and small-cap groups participate. A useful metric is the share of top-50 altcoins with >10% 30-day returns: when >40% achieve that, breadth is widening.
Retail and social signals: Growing search interest, wallet activations for an alt, and rising NFT-to-token cross-activity (when NFT money flows into token markets) are higher-frequency signals to combine with on-chain data.
No single indicator is dispositive. A pragmatic rule is to require three of five signal categories (dominance, OI/flows, on-chain liquidity, breadth, retail) to align before meaningfully shifting allocation.
Translating signals into portfolio rules — a core-satellite, signal-driven approach
The following rules are designed for crypto portfolio managers who need empirical triggers, explicit sizing rules, and tail-risk controls.
Baseline architecture (core + thematic satellites)
- Core (60%–80%): BTC + ETH (if ETH fits your mandate). These positions act as the volatility anchor and long-term store of value exposure.
- Satellite (20%–40%): Allocated to thematic alt exposures — liquidity-layer tokens, infrastructure, and selected high-conviction bets like TAO. Satellites rotate faster and are the place to express altseason.
Example: Starting allocation 65% core (BTC/ETH), 35% satellite. During neutral markets, keep satellite exposure toward the lower bound (20%); during confirmed altseason, move toward the upper bound (40%).
Signal-driven incremental sizing
- Trigger rule: Increase satellite exposure only when at least 3 of 5 indicators (from the checklist above) are satisfied for a continuous 7–14 day window.
- Step sizing: Move in tranches — e.g., add 5% satellite exposure per confirmed tranche up to the pre-set cap. This reduces the chance of buying a short-lived pump.
- Source funds proportionally: Reduce core positions pro rata (e.g., sell BTC and ETH proportionally) or use fresh capital if available to avoid compounding liquidation risk in drawdowns.
Concentration and position limits
- Max single-alt weighting: Cap any individual alt at 5%–8% of portfolio (adjust by mandate size and liquidity). For highly liquid alt like a large-cap token, edge toward the higher end; for illiquid tokens keep it lower.
- Sector caps: No more than 40% of the satellite sleeve in a single sector (e.g., L2s, memecoins, or AI tokens) to avoid sector-specific drawdowns.
Volatility and tail-risk budgeting
- Volatility target: Use a portfolio-level volatility target (e.g., annualized 80% for aggressive crypto mandates) and scale alt additions to stay under that target. If realized volatility spikes above the target, pause alt increases.
- Drawdown stop-limits: If portfolio hits a 20% drawdown from peak after adding alt exposure, automatically reduce satellite exposure by 50% and re-evaluate signals.
- Options and hedges: Use BTC put spreads or tail-protective options for the core sleeve when increasing alt exposure. Keep hedges sized so the cost of protection doesn’t exceed 1%–2% of portfolio AUM per quarter unless the mandate allows higher insurance costs.
Execution and rebalancing cadence
- Rebalance windows: Use weekly micro-rebalances (for position trimming/adding up to 5%) and monthly tactical rebalances (for larger tranche shifts). Avoid intraday chasing of momentum.
- Liquidity-aware entry: For illiquid alts, use dollar-cost averaging (DCA) across multiple blocks and monitor slippage; for liquid alts, limit single-trade slippage to <0.5% of position size.
Stress-testing scenarios and worst-case controls
Portfolio managers should backtest the proposed rules under realistic stress scenarios:
- Rapid BTC rebound: If BTC suddenly outperforms and dominance reasserts, have a rule to unwind satellite positions over 5–10 business days to limit forced selling.
- Alt blow-ups: Cap leverage and use position-level stop-losses (e.g., 30% loss threshold for satellites) or volatility-based size cuts to prevent a single collapse from consuming the risk budget.
- Correlation shock: Run Monte Carlo simulations where alt correlations with BTC jump to 0.9 in a down-leg; ensure that the portfolio’s conditional VaR remains within mandate limits.
Practical tip: maintain a live dashboard tracking the five signal categories, aggregate satellite exposure, largest single-alt weight, and realized portfolio volatility. This turns subjective calls into disciplined, auditable moves.
Case study: How a manager could have used these rules around TAO
Suppose TAO shows a breakout and coverage highlights a potential resistance area (as analysts noted). A manager following the checklist would:
- Confirm the breakout with on-chain volume and DEX swap growth for TAO.
- Check whether BTC dominance is declining and alt breadth is widening; require at least 2 more supporting signals.
- If 3/5 signals align, increase satellite exposure by one tranche (e.g., +5%) and size TAO within the single-alt cap (5%–8%).
- Hedge core with a protective put structure sized to limit portfolio drawdown cost-effectively.
- Monitor for breadth expansion; if breadth fails to follow, trim TAO and pause further alt additions.
This approach permits participation in high-conviction moves like the TAO rally without letting idiosyncratic bets become systemic threats to the portfolio.
Implementation notes and operational considerations
- Track on-chain liquidity metrics via providers or in-house tooling to quantify usable depth (not just headline volumes).
- Use limit orders and algorithmic execution to avoid slippage in thin markets. For large funds, coordinate OTC desks to source liquidity without moving markets.
- Keep a small cash/stablecoin buffer (3%–8%) to act quickly on signal-driven opportunities and to provide margin for hedges.
Managers using installment or P2P tools (including platforms like Bitlet.app) should ensure settlement mechanics and margin rules align with these tactical rebalances.
Conclusion — practical rules, not crystal balls
The early-2026 data shows a meaningful rotation: the NFT market crash removed a marginal liquidity drain while capital re-allocated to altcoins, exemplified by isolated rallies such as TAO. That environment rewards disciplined, signal-driven rebalancing over impulse betting. Use multi-factor triggers, tranche sizing, concentration caps, volatility targets, and explicit tail hedges to capture upside while protecting the portfolio’s risk budget.
No framework eliminates risk, but a structured playbook — as above — converts guesswork into repeatable action. For allocators, the priority is empirical triggers and controlled sizing: increase exposure when breadth, flows, and on-chain liquidity confirm rotation, and always keep the tail risk manageable.
Sources
- NFT sales plunge coverage: NFT sales nosedive 27% to $62.5M, Bitcoin sales dump 65%
- Altcoin rotation analysis: Capital rotates out of Bitcoin as altcoins gain momentum
- TAO rally commentary: Bittensor TAO price rally eyes resistance around 300