Bitcoin’s January 2026 Momentum: ETFs, a Bollinger Squeeze, and the $100k Debate
Summary
Executive snapshot
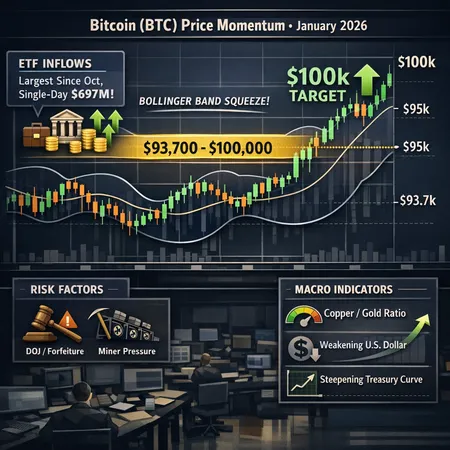
January 2026 has brought a concentrated burst of bullish evidence for BTC: spot Bitcoin ETFs recorded their largest single‑day inflow since October, and on a separate readout roughly $697 million is reported to have been pulled into U.S. spot Bitcoin ETFs as the price held above a key trendline. These headlines, combined with a Bollinger Band squeeze on the charts and macro signals such as a rising copper‑to‑gold ratio, have re‑energized the narrative that a $100k test is plausible in the near term.
This article separates the signal from the noise. I’ll review the institutional flow evidence, the technical setups (what a Bollinger squeeze actually means here), the macro liquidity context to watch, and the asymmetric risk scenarios — then end with a practical trade vs HODL framework for intermediate traders and macro‑focused crypto investors.
ETF inflows and the institutional demand case
Numbers matter. Two datapoints are driving the renewed institutional story: first, a multi‑fund inflow day described as the biggest since October; second, an aggregate ~$697M moved into U.S. spot Bitcoin ETFs according to market coverage while BTC held a key trendline near $93.7k. These flows are more than headlines — they change the supply/demand calculus by pulling BTC out of circulating supply into long‑duration fund inventories.
- Large, concentrated ETF inflows reduce available float. That can amplify upside if demand persists.
- Institutional allocation tends to be stickier than retail FOMO; even moderate recurring inflows matter for price discovery.
Read deeper: coverage of the single‑day large inflow is summarized here and the $697M figure is discussed in this market note.
Why this matters now
ETF flows are not just a volume metric; they act as a liquidity sink in a market where on‑chain and derivatives liquidity interplay tightly. When ETFs absorb large amounts of BTC, they can offset selling from miners or short squeezes and increase the odds of a sustained move — but only if flows continue. Early January’s jump in demand signals a potential institutional bid rebuilding after late‑year consolidation.
Technical setups: Bollinger squeeze, key levels, and what $100k means
Technicians are watching a Bollinger Band squeeze: after a period of tight volatility, Bollinger Bands compress and a directional breakout often follows. One technical take suggests a squeeze breakout could target $100k–$107k if momentum expands upward. That’s not prophecy — it’s a volatility expansion projection if bandwidth and volume confirm the move.
Two price landmarks define the make/break debate:
- $93.7k: referenced as a near‑term trendline; holding this level keeps the bullish case intact.
- $100k: both a round‑number psychological target and a technical resistance band; a convincing close above $100k with strong volume would validate the breakout thesis.
Metrics to watch during a squeeze
- Bandwidth and volume on the breakout candle: volume should expand at least 30–50% above average to have conviction.
- Derivatives open interest and funding rates: rising open interest with positive funding supports a sustained move; asymmetric funding can also seed violent liquidations.
- Short interest and on‑chain outflows into custodial addresses/ETF wallets: sustained net outflows to custodial ETFs corroborate the institutional demand story.
Note: technical patterns are probabilistic. A Bollinger squeeze increases the chance of a sizable move, but direction and follow‑through are determined by liquidity and news flow.
Macro signals: copper‑to‑gold, dollar moves, and liquidity conditions
Macro is the backdrop that either fertilizes or starves an institutional‑led rally. A few indicators stand out this month:
- Copper‑to‑gold ratio: some analysts point out that a rising copper‑to‑gold ratio — signalling risk appetite and real‑economy reflation — has historically correlated with major Bitcoin cycle inflection points. That macro note is covered in a current market piece tying copper, gold and BTC cycle dynamics.
- Dollar weakness: a softer USD increases the local currency buying power of foreign participants and often coincides with growth‑asset rallies.
- Steepening Treasury curve: an improving yield curve (long yields rising relative to short yields) can be read two ways: it implies growth expectations which support risk assets, but it can also reprice financial conditions. The key is whether liquidity remains abundant.
Collectively, these measures form part of macro liquidity. Institutional allocators are sensitive to liquidity cycles; ETF flows are likelier to continue in a constructive macro liquidity environment.
Risk scenarios: what can trip up the breakout thesis
Even with ETF inflows and a neat squeeze, several catalysts could re‑introduce volatility and blow apart the bullish script.
DOJ / forfeiture headlines and regulatory shocks
Legal headlines — DOJ seizures, renewed forfeiture actions, or unexpected regulatory crackdowns — can create rapid, confidence‑destroying flows. The market reacts to headline risk, not just fundamentals. A sudden DOJ announcement tied to a large BTC stash or forced liquidations could prompt cascade selling, especially if leveraged positions are present.
Miner dynamics and on‑chain supply
Miners remain a wildcard. Factors to watch:
- Miner inventory levels and sales: miners selling to cover costs or service debt can increase supply pressure.
- Hashrate and difficulty adjustments: elevated hashrate implies robust mining economics, but if price weakness forces out marginal miners, selling pressure can spike.
- Miner funding/hedging behavior: some miners hedge forward, others do not — hedging patterns can turn a nominal sell‑side into a managed liquidity flow.
ETF demand can absorb miner selling up to a point, but a mismatch (e.g., sustained miner selling vs. waning ETF inflows) would quickly challenge the breakout thesis.
Derivatives, leverage, and liquidity traps
A leveraged short squeeze can accelerate gains, but it also seeds equal risk on the downside. Watch for concentrated options expiries, crowded directional positioning, and funding rate extremes — these are common accelerants for both blow‑offs and mean reversion.
Trading framework: trade vs HODL for intermediate traders
Below are actionable frameworks depending on your time horizon and risk tolerance.
If you’re trading the breakout (shorter horizon)
- Define entry: consider scaling in above a confirmed breakout candle over the Bollinger squeeze with volume confirmation and rising ETF flows.
- Stop management: set stops below the breakout candle low or beneath the $93.7k trendline for tighter risk control.
- Position sizing: keep leveraged exposure moderate; volatile macro headlines can produce 5–10% intraday swings.
- Targets and trailing: partial profit at $100k; if momentum is strong and macro liquidity remains constructive, trail to higher targets ($107k+), adjusting by liquidity signals.
If you’re HODL‑oriented (longer horizon)
- Dollar‑cost average into exposure rather than time the exact breakout; institutional demand supports the long‑term thesis but not timing guarantees.
- Treat ETF inflows as a positive regime change: reallocations into long‑duration vehicles historically support higher long‑term valuations.
- Maintain an emergency risk plan: allocate a small tactical sleeve to hedge or take profits if major negative regulatory or miner events occur.
Practical checklist before you act
- Confirm ETF flow continuity, not just a single day of inflows.
- Watch volume + bandwidth on the Bollinger breakout candle.
- Monitor macro liquidity signals (copper‑to‑gold trend, USD moves, Treasury curve) for supportive context.
- Set explicit stop levels accounting for likely headline risk.
For investors using platforms for recurring purchases or P2P trading, tools like those on Bitlet.app can help execute periodic buys while you watch institutional developments.
Conclusion
January’s mix of ETF inflows, a Bollinger squeeze, and constructive macro signals creates a credible pathway to a $100k test. But credibility is conditional: sustained flows, clean technical follow‑through, and a friendly macro liquidity backdrop are required. Conversely, DOJ news, miner selling, or a sudden liquidity vacuum could snap the move and create sharp reversals.
For intermediate traders and macro investors, the prudent approach is dual: plan for a tactical trade around the breakout with disciplined stops while maintaining a longer‑term allocation plan that recognizes institutionalization of BTC via ETFs.
Sources
- Bitcoin ETFs see biggest inflow since October as institutional demand returns
- Coverage of $697M pulled into U.S. spot Bitcoin ETFs as BTC held above a key trendline
- Technical take on Bollinger Band squeeze targeting $100k–$107k
- Macro note tying copper‑to‑gold ratio to Bitcoin cycle turning points
- Market report on BTC piercing $94k and short squeeze/liquidations context
For further reading on technical setups and custody flows, see related analysis on Bitcoin.