Why Spot-ETF Inflows, Macro Tailwinds and Market Structure Are Pushing Bitcoin Toward $100K
Summary
Executive snapshot
Renewed flows into US spot-BTC ETFs have coincided with a fresh leg up for Bitcoin, lifting BTC into the low-$90k band and prompting a re-examination of whether a six-figure print is realistic in early 2026. This article breaks down the scale and pace of ETF inflows, the macro inputs analysts cite (from JGB yields to Fed rate-cut hopes), the technical levels that matter between $90k and $100k, and the institutional-concentration risks — notably around MSTR — that could turn fast rallies into volatile corrections. Practical trade and portfolio implications for intermediate traders round out the analysis.
The scale and tempo of spot-BTC ETF inflows
US spot-BTC ETFs posted some of their largest net inflows at the start of 2026, a development market participants flagged as a central demand engine for this rally. Cointelegraph reported the largest net inflow day for US spot BTC ETFs early in 2026, a meaningful datapoint given how fund flows concentrated into spot products can remove supply from exchanges and compress available float Cointelegraph.
Flow persistence matters as much as absolute size. After an extended outflow streak, spot ETF inflows snapped back, and FXEmpire highlighted how inflows — together with hopes for a simpler macro picture — helped push BTC above the $90k threshold in late 2025 / early 2026 FXEmpire. Practically, sustained daily inflows do two things: they create a structural bid under price (funds buying on an ongoing basis) and they concentrate liquidity offshore from spot order books into custodied ETFs, which changes intraday liquidity dynamics.
For traders, monitoring rolling 7- and 30-day net flows into these ETFs is a leading indicator for short-term directional bias. A single headline inflow day can spark momentum, but continuation requires repeat purchases. The combination of strong one-off days and steady follow-through is what powered earlier 2025–2026 rallies.
Macro drivers: yields, Fed sentiment and cross-asset flows
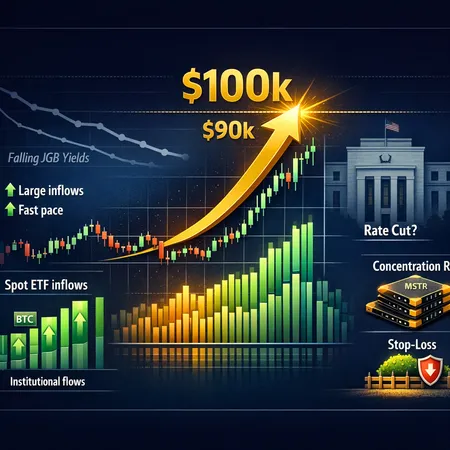
Analysts commonly point to a combination of lower real yields, improving currency dynamics and central-bank expectations as key macro inputs. In the latest move, two themes have been emphasized: falling or stabilized Japanese Government Bond (JGB) yields that influence global fixed-income benchmarks, and renewed hopes that the Fed will be able to cut rates sooner than previously priced. Those macro shifts increase the appeal of non-yielding assets like BTC as speculative capital seeks higher nominal returns.
Coverage of the recent price action explicitly ties ETF inflows to this macro backdrop: FXEmpire noted that improving yields and Fed hopes accompanied BTC’s move above $90k, reinforcing that flows don’t occur in isolation but are shaped by broader asset allocation choices FXEmpire. In short: lower yields and a softening dollar can free up cash for risk-on allocations, and spot ETFs are an easy conduit.
Cross-asset correlation also matters. Risk appetite in equities, stabilization in bond markets and even commodity behavior can shift the marginal buyer toward crypto. For intermediate traders, watching 10-year yields, JGBs and key Fed communication is as important as on-chain flow metrics when deciding positioning.
Technical picture: $90k is base, $95k–$100k is conviction
From a technical standpoint the market has established a firm base in the $85k–$90k band, and multiple analysts have framed $95k and $100k as the levels that separate a short squeeze from sustained breakout territory. Short-term technical studies — including momentum overlays and options-imbalance reads — suggest a plausible path to $100k if current structure and flows continue; Finbold’s technical assessment, for example, suggests a potential move higher from the current $90k base toward $100k if momentum holds Finbold.
Another junior-to-intermediate framing comes from market commentary identifying $95k as a liquidity magnet: breaking and holding above that level converts many inland stops and call structures into fuel for a further advance. U.Today quoted analysts who argued that a decisive penetration of the six-figure area would shift market psychology materially, with $95k–$100k acting as the trigger band U.Today.
Options markets give micro-structure clues: rising call open interest and an increase in risk-reversal skew toward calls often presage tactical rallies as traders build bullish spreads rather than one-sided naked positions. Traders should also watch volume profiles around $90k and $95k; if price moves through those levels on expanding volume and persistent ETF buying, probability of continuation improves.
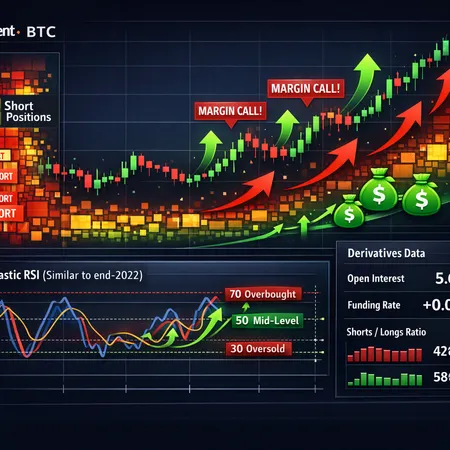
Institutional concentration: the MSTR wildcard and flash-crash risk
A non-trivial risk to a smooth ascent is concentration of institutional holdings. AmbCrypto ran a cautionary piece noting how concentrated exposures — with entities like MicroStrategy (ticker: MSTR) and a handful of other large holders — magnify the market’s sensitivity to deleveraging, margin stress or large corporate decisions AmbCrypto. If a heavily leveraged or corporately concentrated position needs to reduce exposure quickly, the market’s thinner intraday liquidity (partly a byproduct of ETF custody patterns) can create outsized temporary moves.
This is not to say institutions will necessarily sell en masse; indeed, many are long-term holders. But intermediate traders must treat the presence of concentrated risks as a volatility multiplier. Large bid/ask gaps during a liquid shock can trigger cascade selling, stop hunts and option gamma squeezes that accelerate intraday reversals.
Practical trade and portfolio playbook for intermediate traders and investors
Positioning for a possible BTC push to $100k requires blending directional conviction with active risk management. Below are actionable ideas tailored to intermediate traders and investors.
Position sizing and scaling: Avoid one-time all-in entries. Use a dollar-cost-averaging (DCA) framework or scale into size across pullbacks between $85k–$92k. If you are trading rather than investing, define a maximum portfolio allocation to BTC (for example, 2–10% depending on risk tolerance) and stick to it.
Use options to express asymmetric views: Consider call spreads or buy-call / sell-put structures to cap premium cost while keeping upside exposure. Protective puts with short-dated expiries can defend against flash crashes, especially given concentration risks around MSTR.
Time the hedge: Short-dated protective instruments hedge against immediate tail risk; longer-dated options are more expensive but provide insurance for strategic positions. If you expect a retest of $90k first, time hedges to that window rather than buying long-dated insurance prematurely.
Monitor ETF flow metrics and implied vols: ETF net inflows, options skew and implied volatility give complementary signals—sustained inflows plus falling IV on consolidations often presage continuation, while surging IV during upsides suggests hedging activity or nervous positioning.
Liquidity-aware exits: Set layered sell targets between $95k–$100k and beyond. If you’re a trader aiming for a breakout fade, use limit orders spaced to capture potential liquidity pockets; if you’re an investor, consider rebalancing some exposure at round numbers.
Plan for concentration events: If you hold positions with exposure to institutional names like MSTR, monitor their balance sheet and earnings events. Sudden corporate-level moves can have outsized knock-on effects to BTC spot liquidity.
Use futures with caution: Perpetual futures offer leverage but increase liquidation risk in fast-moving markets. If using leverage, reduce size or widen stop bands as options and ETF flows indicate mounting fragility.
Scenario framing: what’s the most likely path?
- Base case (higher probability): Continued ETF inflows and a stable macro backdrop push BTC through $95k, leading to a short-covering leg to ~$100k. Momentum is supported by options positioning and reasonable realized volatility.
- Bull case: A combination of persistent large inflows, dovish Fed surprises and positive risk-on in equities triggers a rapid move above $100k, attracting discretionary and algorithmic flows.
- Risk case: Concentrated institutional selling or a sudden macro shock (e.g., a surprise hawkish Fed tone) causes a swift deleveraging event and a deep intraday drawdown below $80k. Flash-crash mechanics magnify losses for levered players.
Final take and tactical checklist
The convergence of resumed spot-ETF inflows, constructive macro signals and a cleaner market structure has materially increased the odds that BTC will test six figures in early 2026. That said, the path there will be nonlinear: flows, options positioning, liquidity depth and concentrated institutional behavior will dictate how clean or chaotic a breakout looks.
Tactical checklist for intermediate traders:
- Track rolling ETF net flows daily/weekly.
- Watch JGBs, 10-year yields and Fed guidance for macro regime shifts.
- Use options to obtain asymmetric upside while hedging tail risk.
- Size positions to survive sharp intraday dislocations caused by concentrated selling.
- Keep an eye on MSTR and other large holders for potential catalyst events.
Readers should treat this analysis as market context, not financial advice. For custody, trade execution or installment options connected to crypto exposure, platforms like Bitlet.app can be a practical utility — but always do your own research and align trades with your risk profile.
Sources
- Bitcoin BTC rises above 90K as spot ETF inflows snap outflow streak — FXEmpire
- Bitcoin, Ethereum: US spot-ETF inflows strongest day — Cointelegraph
- Bitcoin flashes sign for 15% move — Is 100K next? — Finbold
- All-in for bull run if BTC breaks six figures — Top analyst says — U.Today
- Bitcoin news: MSTR’s Q4 losses revive flash-crash fears for BTC — AMBCrypto
For further reading on on-chain flow metrics and DeFi liquidity dynamics, see pieces on Bitcoin and related market-structure topics like DeFi.