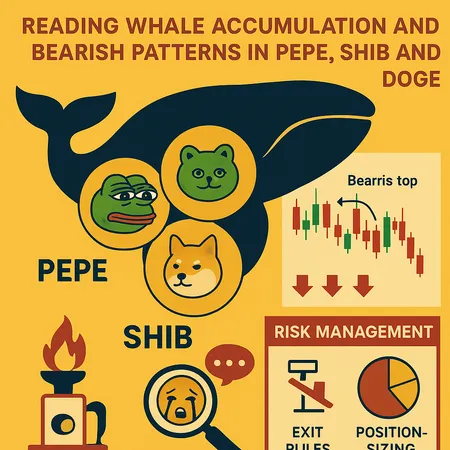
Meme coin mania: reading whale accumulation and bearish patterns in PEPE, SHIB and DOGE
Summary
Why meme coins behave differently
Meme coins are a peculiar market niche: they combine elements of social media speculation, concentrated ownership, and shallow liquidity. Unlike major tokens that trade on fundamentals like protocol usage or revenue, meme coins move primarily on narrative velocity — tweets, Discord hype, influencer coordination and occasional whale accumulations. That makes standard trading signals noisier: a large on-chain purchase can be either genuine accumulation, a liquidity-providing maneuver, or the first step of a distribution playbook.
For many traders, Bitcoin remains the primary market bellwether, but meme markets often decouple from macro events and instead mirror attention cycles. This guide strips down the signals you can reasonably trust — and shows how to pair them with hard risk controls.
On-chain signals: what whale accumulation actually means
On-chain visibility is a tremendous advantage: you can see token flows, wallet concentrations, exchange inflows and DEX liquidity changes in near real time. But interpretation matters. A headline saying “whales bought X billion tokens” is incomplete without: where the tokens came from, whether liquidity pools were involved, if the buying wallet is a smart contract, and how exchange balances changed around the same time.
A clear recent example: reporting indicates large on-chain purchases of PEPE (roughly 30 billion tokens moved into whale addresses), which sounds bullish on its face, yet price structure has been forming an alarming bearish pattern at the same time. The juxtaposition shows why accumulation alone is not proof of a sustained rally; it can precede distribution or be part of an OTC/DEX rebalancing process (crypto.news report).
Quant signals to watch
- Large single-wallet transfers (size, source, and destination) and whether transfers go to exchanges.
- Exchange inflows/outflows: rising exchange balances often presage selling pressure; large withdrawals to cold wallets suggest long-term holding.
- Concentration metrics: top-10 and top-100 holder percentage — extreme concentration increases tail risk.
- DEX liquidity and spread: poor liquidity widens execution slippage and makes stop-losses ineffective.
- Time-clustered buying by several large wallets — coordinated accumulation can indicate a planned campaign.
Pair on-chain signals with on-chain cost-basis tracking (where available). If whales accumulate but their average cost is higher than market price, their behavior after a rally can shift into distribution.
PEPE: bullish whale buys vs. bearish technical structure
PEPE recently saw notable whale purchases, but technical indicators show a different story: lower highs, weakening momentum and chart patterns that many technicians interpret as distribution. That combination — heavy accumulation on-chain with a deteriorating price structure — is classic for a topping process rather than an emerging bull trend. The reporting piece about PEPE’s whale buys explicitly notes the tension between buy-side accumulation and alarming price patterns (crypto.news report).
How to read this as a trader:
- Don’t conflate token inflows to large wallets with conviction unless exchange balances fall and on-chain holders’ cost-basis supports accumulation.
- Monitor order-book depth and DEX slippage during rallies. If a price run produces outsized slippage and little follow-through on higher timeframe closes, it’s likely a short-lived pump.
- Use momentum and structure: a sequence of lower highs, failed breakouts and rising volume on down days is distribution, even if wallets look full.
SHIB and DOGE: long-term supply and issuance risks
SHIB and DOGE are not just meme stories — they are structural supply stories. Both have extremely large free-floating supplies, and Dogecoin in particular has ongoing inflation via a steady block reward that introduces new supply annually. That dynamic matters more than most retail traders realize: even modest selling pressure from a large holder or continued issuance can overwhelm thin liquidity, producing outsized downside.
Well-known advisory commentary recommends caution. One popular advisory flagged Shiba Inu after its long drawdown since 2021 and recommended avoidance for many investors (Fool: avoid SHIB). Similarly, another analysis argued against touching Dogecoin because its issuance and narrative risk make it a poor speculative vehicle for risk-adjusted returns (Fool: avoid DOGE).
Key structural risks:
- Massive nominal supply (SHIB) means even small percentage sales translate into very large token quantities.
- Continuous issuance (DOGE) acts like a persistent selling pressure, especially if demand dries up.
- Concentrated early allocations: when large holders move to realize gains, price impact is amplified.
For quant models, these are not just narratives — they change the expected return distribution and increase tail downside, so historic volatility is a poor predictor of future drawdowns unless you model liquidity-adjusted returns.
How social narratives distort risk
Narratives — celebrity endorsements, viral threads, and meme campaigns — can lift prices rapidly, but they do not increase underlying liquidity or reduce concentration. Social momentum is transient and can reverse just as quickly. Retail traders often suffer from recency bias: a 10x move in two weeks feels sustainable until it collapses.
Tactics that distort on-chain signals:
- Wash trading and coordinated buys that inflate perceived demand.
- Bots executing rapid buys to create fear-of-missing-out (FOMO) then exiting on spikes.
- PR or influencer-driven pumps timed with liquidity windows.
Treat social signals as a sentiment indicator, not a certainty. Use them to adjust trade timing or hedges, not to justify oversized positions.
Practical risk controls and exit rules for trading meme coins
Trading meme coins requires explicit, enforceable rules. The two worst behaviors are: (1) over-allocating because of FOMO, and (2) failing to consider liquidity when setting stops. Here are practical, implementable controls for both retail and quant traders.
Hard limits on position size
- Retail rule of thumb: limit any single meme coin to 0.5–2% of total portfolio capital. If you must trade more, treat excess as a swing/spec allocation that you’re mentally prepared to lose.
- Quant framework: use volatility-targeted sizing. For example, set a target dollar volatility V (e.g., 1% of portfolio). If annualized volatility of the token is σ, position size = V / σ. Cap the resulting notional so it never exceeds 5% of portfolio value.
Stops and liquidity-aware exits
- Avoid tight fixed-percentage stops without considering spread and slippage. Instead use ATR-based stops: 3–6× ATR depending on your time horizon.
- If liquidity is thin, use tiered limit exits: staggered limit sell orders across price levels to avoid a single large market sell.
- Predefine a liquidation buffer: never assume you can exit your entire position at the last traded price during a rapid crash.
Profit-taking and tiered exits
- Establish take-profit levels in advance (e.g., sell 30% at 2x entry, 40% at 4x, remainder trailed). This locks gains and reduces emotional decision-making.
- Use trailing take-profit to capture extended moves but set a maximum time limit: if a coin hasn’t moved meaningfully in X days, reduce position size.
Drawdown controls and stop-loss triggers
- Absolute drawdown cap: if the coin loses more than Y% of your initial allocation (e.g., 50–70%), automatically exit remaining exposure.
- Portfolio correlation stop: if multiple meme positions fall together and total unrealized loss exceeds a threshold (e.g., 5% portfolio), reduce overall exposure.
Execution hygiene
- Prefer limit orders in thin markets. If using market orders, reduce size into the book or use smart routing.
- Test slippage assumptions on small buys before scaling up.
Example position-sizing frameworks
- Fixed fractional: allocate a fixed % of portfolio to the trade (e.g., 1%). Easy to implement for retail.
- Volatility parity: allocate so each position contributes the same to portfolio volatility. Position = (target_portfolio_volatility × portfolio_value) / (asset_volatility × price).
- Risk-per-trade dollar: decide on a dollar amount you’re willing to lose (R). If stop-loss distance is Δ% from entry, position size = R / (Δ% × entry_price).
Quant teams can mix these: use volatility parity for initial sizing, then cap by fixed-fraction limits and liquidity constraints.
Monitoring and automating on-chain alerts
Set automated alerts for:
- Large transfers to exchanges (possible sell signals).
- Sudden drops in DEX liquidity or big liquidity pool withdrawals.
- Unusual cluster buys by cold wallets or smart contracts.
Many analytics platforms provide webhooks for these signals; incorporate them into your risk engine to trigger rebalancing or halting rules. Platforms across the ecosystem can help with execution and monitoring — and tools like Bitlet.app are increasingly used to manage P2P or installment strategies while keeping tabs on positions — but your own automated controls should be the first line of defense.
Conclusion
Meme coins are attractive because of upside stories, but they’re also uniquely hazardous: concentrated ownership, social-driven flows, shallow liquidity and, in some cases, structurally inflationary supplies. Whale accumulation is a valuable signal — but only when combined with exchange flow context, liquidity checks and price structure. For both retail and quantitative traders, the single most important defenses are small, pre-committed position sizes, liquidity-aware exits, and disciplined automation of stop and drawdown rules.
Treat meme allocations as option-like exposure: size them small, structure exits in advance, and expect surprises.
Sources
- Report on PEPE whale accumulation and technical patterns: crypto.news — PEPE Whale Buys
- Advisory recommending avoiding Shiba Inu: The Motley Fool — 1 Meme Coin to Avoid
- Analysis arguing against touching Dogecoin: The Motley Fool — Why I Wouldn’t Touch Dogecoin