What the Last 48 Hours of On‑Chain Flows Tell Institutional Traders About the BTC Shock Below $90K
Summary
Executive summary
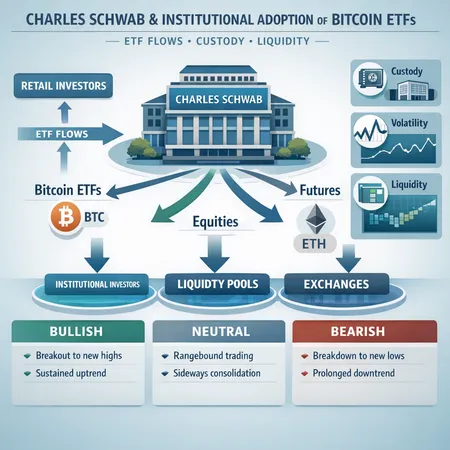
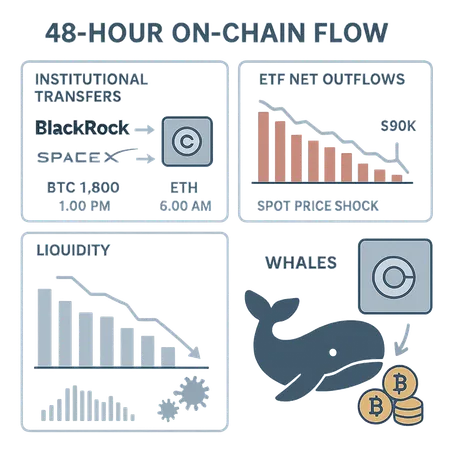
Over 48 hours the market digested a set of apparently contradictory on‑chain signals: high‑profile transfers of BTC and ETH into Coinbase by institutions, large ETF outflows, visible whale accumulation data, and a sharp intraday price shock that pushed BTC briefly below $90,000. Taken together, these events tell a coherent story about liquidity moving from off‑exchange custody and over‑the‑counter channels onto centralized venues, transient reductions in institutional ETF demand, and a market microstructure primed for a cascade once a price pivot was triggered. For trading desks, the episode is a reminder that supply can appear at the exchange faster than demand can absorb it, and that whales can accumulate structurally even while short‑term price discovery goes the other way.
Timeline: notable on‑chain transfers and the institutions involved
Over the past two days blockchain explorers and on‑chain desks recorded several high‑value transfers into Coinbase, the most cited being movements attributed to BlackRock and a SpaceX‑linked wallet. Early reporting flagged coordinated transfers of both BTC and ETH to Coinbase ahead of key US inflation data, a classic pre‑news liquidity positioning move by institutions that need exchange access for hedging or execution purposes. Reporting summarized this flow: BlackRock and SpaceX moved BTC and ETH to Coinbase ahead of key inflation data.
Rough timeline (publicly reported):
- T‑48 to T‑36 hours: Multiple transfers from large custodial or institutional addresses routed to Coinbase hot wallets. These included both BTC and ETH amounts that triggered on‑chain analytics alerts. Some transfers were explicitly flagged as originating from custodial-like addresses associated with major asset managers.
- T‑24 hours: A concentrated BTC transfer attributed to BlackRock — later quantified by follow‑up coverage as approximately $125M in BTC moved — landed on Coinbase, coinciding with heightened derivative activity and elevated funding‑rate sensitivity across perpetual markets.
- Immediate pre‑print window: Additional ETH transfers to Coinbase appeared, underscoring that institutions were positioning across both major layers (spot BTC and ETH) before the macro release.
A note on intent: transfers to an exchange are ambiguous by themselves. Institutions often move assets to exchanges to (a) execute spot trades, (b) hedge via futures or options, (c) provide liquidity for client redemptions, or (d) rebalance custody. The timing ahead of an inflation print, however, increases the probability these moves were at least partially hedging or liquidity‑seeking in nature rather than routine bookkeeping.
ETF outflows and what they say about demand elasticity
Across the same window ETF flows were notably negative. On‑chain and market commentators flagged a day of concentrated ETF outflows, with one report citing approximately $194M pulled from Bitcoin ETFs in a single day. That magnitude, when combined with exchange inflows, imposes downward pressure on immediate spot liquidity and signals elastic demand among ETF participants — i.e., flows that reverse quickly when short‑term risk rises.
The combination matters: if institutions move spot supply onto exchanges at the same time ETF channels are seeing outflows, the net available buy‑pressure from ETF channels softens while sell‑side liquidity increases. Put simply, the market’s natural shock absorbers were thinner. This dynamic amplifies price moves and increases the likelihood of slippage and liquidation cascades for leveraged players. Coverage that quantified both the BlackRock transfer and the ETF outflows provides a useful read on the interplay between on‑chain transfers and product‑level demand dynamics (BlackRock $125M BTC move, ETF $194M outflows).
Whale accumulation: the long‑term buyer versus short‑term sellers
At first glance the price action and whale activity appear contradictory. On one side, on‑chain analytics recorded substantial accumulation by large addresses over recent weeks — a dataset highlighted by trackers reporting that whales added 47,584 BTC in December. That kind of accumulation suggests strategic, multi‑week to multi‑month buy intent from entities that are not playing intraday. See the aggregation analysis here: Whales added 47,584 BTC in December.
How do we square persistent accumulation with a sudden price slide? The resolution is in the difference between where large holders keep assets and how quickly exchange orderbooks can absorb newly available sell pressure. Whales can accumulate off‑exchange (cold custody, OTC desks) while pockets of liquidity on centralized orderbooks remain shallow. When institutions move assets to Coinbase, those coins become immediately spendable liquidity. Even if whales continue to accumulate overall, short‑term spikes in sell supply (exchange inflows plus ETF outflows) can overwhelm resting buy interest and trigger disorderly price discovery.
In other words: whales may be structurally bullish while simultaneously being incapable or unwilling to step into intraday bids during macro noise. Many large buyers prefer layered accumulation at longer time horizons; they will not chase every dip. That patience can create an impression of divergence between on‑chain accumulation metrics (net positive) and price momentum (net negative) in compressed windows.
The price shock below $90K: microstructure and liquidation mechanics
The market dislocated sharply, with BTC breaching the $90K mark in a series of rapid prints that drove liquidations. Market commentary and orderbook analysis point to two compounding forces:
- Elevated exchange inflows (institutions moving coins to Coinbase) that increased immediate sell liquidity.
- ETF outflows reducing a key source of demand, tightening the bid side.
Traders observed a classic pivot/liquidation sequence: a large sweep or block sell poked thin orderbook depth, stop‑loss ladders trigged across exchanges, funding‑rate dynamics forced deleveraging in perpetuals, and cross‑market arbitrage could not re‑establish equilibrium instantly. Reporting on the intraday fall below $90K documented those microstructure effects and the associated liquidations that exacerbated the move (report on drop below $90K and liquidations).
What this episode teaches trading desks: practical spot and derivatives risk‑management
Below are concrete takeaways for institutional traders, execution desks, and risk managers who must translate on‑chain signals into actionable procedures.
1) Treat exchange inflows as potential sell‑pressure triggers — but confirm intent
An incoming transfer to Coinbase increases the capacity to sell, not the intent to sell. However, when transfers cluster ahead of macro prints or coincide with ETF outflows, treat the event as higher probability for near‑term liquidity provision. Monitor intermediary addresses, custody tags, and time‑of‑day patterns. Combine on‑chain alerts with market microstructure indicators (orderbook depth, best bid/ask sizes) before assuming a benign motive.
2) Monitor ETF flows as a quick barometer of institutional demand elasticity
ETF flows can flip fast and have outsized market impact when they represent a large portion of marginal institutional buying. Rapid outflows (e.g., $194M in a day) are a warning sign that passive institutional buyers may not re‑enter at the first dip. Risk desks should widen stress scenarios to model reduced ETF liquidity and test cross‑product hedges accordingly.
3) Recalibrate execution strategies when whales are accumulating but orderbook depth is shallow
Whale accumulation signals long‑term conviction but do not guarantee intraday support. Use execution algorithms (TWAP/VWAP with liquidity filters, iceberg orders) and avoid market‑sized aggression into noisy macro windows. If hedging, prefer staged hedges and optionality rather than large immediate swaps that move the market.
4) Anticipate and protect against liquidation cascades on derivatives books
When exchange inflows, ETF outflows, and thin orderbooks align, liquidation cascades become more probable. Derivatives desks should stress test margin ladders, tighten pre‑trade risk controls, and consider temporary increases in margin requirements or concentration limits during macro prints. Monitor funding rates — persistent extreme funding is both a signal and a lever for forced deleveraging.
5) Use cross‑signal triangulation: on‑chain flows + orderbook + OI + funding
No single metric is decisive. Combine: (a) exchange inflows from on‑chain analytics, (b) real‑time orderbook depth, (c) derivatives open interest and skew, and (d) funding rates. This triangulation helps distinguish custody positioning moves from imminent liquidity events. Platforms like Bitlet.app are built to integrate custody and execution primitives for payment and settlement workflows, but desks should still overlay independent on‑chain fees and mempool observations when sizing risk.
How to operationalize monitoring (short checklist)
- Set high‑priority alerts for large transfers to major exchanges (Coinbase, Kraken, Binance) tagged to known custodians.
- Maintain an ETF‑flow watch: daily net flows, AUM changes, and product‑level redemptions.
- Track whale accumulation metrics weekly, but treat them as structural not tactical.
- Monitor bid depth at top‑5 venues and compute expected price impact for notional trade sizes.
- Run intraday liquidation stress tests tied to observed funding spikes.
Conclusion: coherent narrative and implications
In the past 48 hours the market produced a clear, coherent narrative: institutional transfers to Coinbase increased immediate sell capacity just as ETF channels softened, while whales continued structural accumulation off‑exchange. The result was an ideal condition for a rapid price repricing and a cascade of liquidations that drove BTC below $90K briefly. For institutional traders and risk managers the lesson is straightforward: integrate on‑chain flow data into execution and risk frameworks, treat exchange inflows with contextual skepticism, and assume demand elasticity can flip faster than long‑term accumulation metrics suggest.
Sources
- Report on institutional transfers to Coinbase: BlackRock moves BTC and ETH to Coinbase ahead of key inflation data
- Quantification of BlackRock $125M BTC transfer and market reaction: BlackRock $125M BTC move
- ETF outflows data and one‑day $194M withdrawal analysis: Why are institutional investors withdrawing massively?
- Whale accumulation evidence: Whales added 47,584 BTC in December
- Market microstructure report on the sub‑$90K move and liquidations: Bitcoin drops below $90,000 despite stock market rise
For many traders, monitoring Bitcoin and Ethereum on‑chain flows alongside product flows (ETFs, OTC) will remain the most reliable way to reconcile short‑term volatility with longer‑term accumulation trends.