How to Trade the Zcash Rout: 24% Crash, EMA200 Break, and a Risk‑Managed Playbook
Summary
Executive snapshot
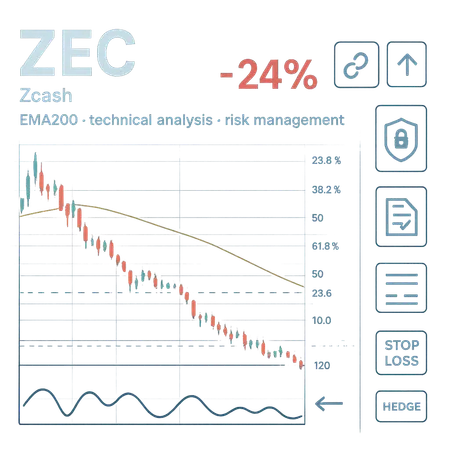
Zcash (ZEC) plunged about 24% in a sharp correction that began when the price failed to hold several short‑term structures and decisively broke the EMA200 on the daily chart. Coverage across market outlets noted the speed and breadth of the move and flagged the potential for follow‑through downside if key supports stayed broken. This piece walks through the technical anatomy of the drop, summarizes the on‑chain and macro drivers analysts are citing, and — most importantly — offers a tactical playbook for traders and risk managers who need a measured response to privacy‑coin volatility.
What happened: the 24% rout in context
The headlines were blunt: ZEC led the pullback with a dramatic decline, and analysts warned of a further drawdown if market structure deteriorated. Several reports documented the same basic sequence — a failed bounce, break of the 200‑day exponential moving average (EMA200), and rapid liquidation of short support bands — which together catalyzed stop‑run selling and short pressure. See the market coverage noting the drop and analyst commentary on the technical breaks for the initial reporting and perspectives: NewsBTC coverage of the 24% drop, the deeper technical recap of lost support levels at Crypto.News, and a market‑watch piece that places this correction alongside BTC action at CryptoPotato.
Technical analysis — what the charts are telling us
On a daily basis the decisive event for many traders was the break below the EMA200. In trending markets the EMA200 is commonly used as a proxy for medium‑term trend: a clean, candle‑close below it typically signals momentum has shifted to sellers. For ZEC the break coincided with the erosion of multiple short supports (e.g., prior swing lows and intraday demand zones), which amplified selling as market participants' stop orders clustered beneath those levels.
Zooming out, the technical damage looks like a classic trend invalidation: momentum faded near a local resistance area, price failed to hold a range low, then descending volume on bounces suggested a lack of buying conviction. From a structure standpoint, watch for three key levels that traders referenced in coverage and on‑chain overlays: the immediate re‑test zone near the broken support (often a first objective for mean reversion), the next historical demand band where liquidity historically appeared, and a longer‑term macro support that would be critical for thesis‑level holders.
Technically, risk managers should treat a retest of the EMA200 as a high‑probability decision point: a failure to reclaim it on retest reinforces a bearish path; a firm reclaim with volume and higher lows could re‑establish a trend change. For those comfortable with layered entries, the path from here is either defensive (hedge / reduce) or opportunistic (staged buys on confirmed levels), depending on mandate and time horizon.
On‑chain and macro drivers cited by analysts
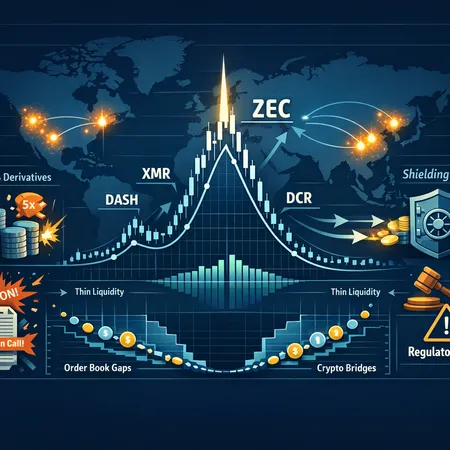
Analysts and market watchers have pointed to a mixture of proximate technical drivers (stops and liquidity) and broader macro or on‑chain signals. On the on‑chain front, privacy coins like Zcash can show concentration risk: exchanges and large wallets can act as sources of supply when market stress accelerates. While ZEC does not have the same on‑chain niceties as transparent blockchains for some metrics, observers still monitor exchange flows, wallet concentration, and shielded‑to‑transparent activity for clues about liquidity migration.
Macro drivers include risk‑off flows from broader crypto markets and shifting capital allocation in response to macroeconomic data. In the recent move, some outlets noted how BTC's own volatility and sub‑$84k wobble correlated with altcoin weakness; when the primary bellwether stumbles, alts often suffer amplified reversals. For many traders, Bitcoin remains the primary market bellwether and altcoins — particularly less liquid ones — feel the impact more acutely.
Taken together, the narrative is: technical failure (EMA200 and key supports) triggered a liquidity cascade; concentrated holders, reduced buy‑side depth, and cross‑market risk‑off dynamics amplified the drop. Coverage from the cited market pieces helps corroborate that sequence and gives context for short‑term scenario planning (see linked reports above).
Practical risk‑managed playbook for traders and funds
Below is a tactical framework geared to asset managers, prop desks, and active traders who must respond to deep altcoin corrections while preserving a longer‑term privacy‑coin thesis.
1) Reassess thesis and horizon first
Before trading, funds must separate noise from thesis risk. Ask: Is my ZEC allocation based on a short‑term trade or a multi‑year thesis on the privacy‑coin sector? If the thesis depends on protocol fundamentals (privacy adoption, protocol upgrades), a temporary drawdown alone may not invalidate it. If thesis hinges on immediate liquidity or short‑term catalysts, consider cutting exposure or hedging quickly.
2) Immediate liquidity and stop governance
Institutions should have pre‑agreed stop or liquidity thresholds. For discretionary traders, avoid emotion‑driven decisions: use a rule‑based stop (percentage, structure break, or volatility stop). For funds, prefer layered liquidity management over single binary cuts — trim into strength rather than sell at the panic low. Remember: slippage and market impact are larger in small‑cap or lower‑liquidity privacy coins.
3) Position sizing and scaling rules
Implement a two‑axis sizing rule: maximum core allocation (long‑term thesis) and tactical allocation (trading). Core positions are held with wider drawdown tolerances; tactical positions must have strict stops. Use scaling‑in on pullbacks with predetermined bands — e.g., buy 30% at the first confirmed support, 40% at a deeper band if breached, and reserve 30% for opportunistic accumulation if the long‑term support holds.
4) Hedging and derivatives
Where available, use options or futures to hedge directional risk. A protective put replicates a stop but avoids on‑chain execution in illiquid venues; short futures contracts or buying inverse products work too, but be mindful of funding rates and counterparty exposure. If derivatives markets are shallow for ZEC, hedge using a BTC hedge ratio based on historical correlation, but track the basis risk: ZEC may diverge from BTC during privacy‑specific news.
5) Use liquidity and custody best practices for privacy coins
Privacy coins can attract regulatory attention and require extra custody controls. Ensure custody providers support ZEC properly and that withdrawal limits and KYC/AML considerations are baked into operational plans. During volatility, choose execution venues with the deepest order books and avoid fragmented fills across many small exchanges unless you have an aggregation strategy.
6) Options for active traders: retest bias and event‑driven entries
Active traders can look for a retest of the EMA200 or prior support as a clean decision point. A retest failure signals further downside and an opportunity to short or hedge; a successful reclaim with volume signals a possible trend resumption. Event‑driven entries — for example, protocol upgrade news or liquidity injections — can provide asymmetric risk setups if the market underprices the news.
7) Monitor on‑chain indicators and concentration risk
Even imperfect, on‑chain and flow metrics help: watch exchange inflows for sudden spikes (indicates selling pressure), large wallet movement patterns, and shielded‑to‑transparent flows that may presage distribution. For funds, maintain a watchlist of whale activity and set alerts for abnormal exchange flows so you can act before a liquidity squeeze.
8) Scenario planning and communication
Funds should model scenarios: shallow recovery, protracted bear, and capitulation. For each, define trigger points (price, volume, on‑chain signals) and the accompanying tactical response (hold, hedge, cut, or accumulate). Clear internal communication and templated client updates reduce the pressure to make ad‑hoc decisions mid‑stress.
Example tactical playbook (concrete steps)
- Immediate: Pause incremental buys; review outstanding hedge mechanisms and activate if risk limits breached.
- 0–7 days: Monitor retest of EMA200. If price reclaims EMA200 on higher volume, consider scaling partial re‑entries with tight micro‑stops. If EMA200 stays resistance, gradually reduce tactical exposure.
- 7–30 days: Execute layered accumulation only into established historical demand bands and use options/futures to maintain hedge coverage during accumulation.
- Ongoing: Track exchange flows, large wallet moves, and macro drivers (BTC behavior, rates news). Recalibrate core allocation only if fundamental thesis materially changes.
Preserving the privacy‑coin thesis amid volatility
Maintaining conviction in privacy coins like ZEC requires distinguishing between transient market noise and structural threats (e.g., adverse regulation, protocol failure). If fundamentals remain intact — active development, community support, and demonstrable use cases — temporary drawdowns are often buying opportunities for patient capital. Conversely, if regulatory developments or liquidity crises alter the protocol's operability, that elevates thesis risk and demands portfolio action.
For those managing client capital, articulate the thesis and the conditions under which it would change. That way, drawdowns become expected variance rather than a surprise requiring emotional action.
Bringing it together: decision framework for the next move
- Re‑confirm your time‑horizon and thesis. If long‑term thesis unchanged → consider staged accumulation with hedges. If thesis impaired → reduce exposures quickly and cleanly.
- Use the EMA200 retest and volume behavior as a tactical gate. Reclaim + volume = tentative bullish signal; failure = maintain defensive posture.
- Size positions with explicit tactical vs core buckets and use derivatives to manage tail risk where possible.
- Monitor on‑chain flows, exchange liquidity and broader crypto macro (BTC), and be ready to act on defined triggers rather than impulses.
For traders familiar with other markets, these are familiar rules adapted for crypto’s idiosyncratic liquidity and regulatory landscape; for newer risk managers, platforms like Bitlet.app can help operationalize recurring buys and manage execution, but custody, compliance, and hedging remain the decisive operational elements.
Conclusion
The ZEC 24% rout was a stark reminder that even established altcoins can see swift technical breakdowns when the EMA200 and clustered supports fail. The market moves fast; the correct response is not panic but a structured, rules‑based reaction: reassess thesis, control size and liquidity, hedge tactical risk, and use staged re‑entry if fundamentals hold. Traders and funds that prepare playbooks for these episodes — with explicit triggers and governance — will preserve capital and remain ready to capitalize when volatility subsides.
Sources
- NewsBTC — Zcash leads market pullback with 24% drop: https://www.newsbtc.com/news/zcash-zec-leads-market-pullback-with-24-drop-analysts-warn-of-another-crash-ahead/
- Crypto.News — Zcash price crashes 24% as price loses key support levels: https://crypto.news/zcash-price-crashes-24-as-price-loses-key-support-levels/
- CryptoPotato — ZEC's massive correction continues; BTC recovers from sub‑84k drop: https://cryptopotato.com/zecs-massive-correction-continues-btc-recovers-from-sub-84k-drop-market-watch/