Anatomy of Bitcoin’s Early-December Flash Crash: JGB Shock, Liquidations, and What Comes Next
Summary
Executive framing — why this crash matters
Early December’s sharp Bitcoin sell-off was not just another price wobble. It combined a macro shock in Japanese government bond yields with structural fragility in crypto markets: thinned order books going into month-end, concentrated ETF and index rebalancing flows, and algorithmic liquidity providers that withdrew or reversed within seconds. The result was a fast, mechanically amplified cascade of liquidations that punished levered positions and left the market asking how resilient BTC is to macro shocks going forward. For many traders, Bitcoin remains the primary market bellwether — and this event exposed how quickly that bell can be rung.
What happened — timeline reconstruction
Below is a concise timeline that stitches together public reporting, exchange data, and block- and derivative-level evidence.
T minus: markets enter late month/early December with lower spot volumes and typical holiday thinning of liquidity on retail-focused venues. ETF and rebalancing flows are scheduled across exchanges.
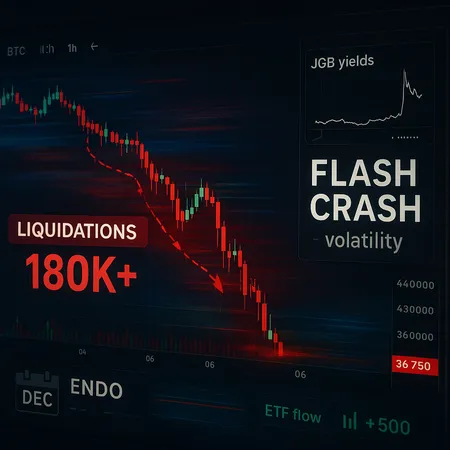
Trigger (T0): a sharp, unexpected move in Japanese government bond yields — a JGB yield shock — reprices global risk assets and FX. Crypto participants respond to the cross-asset shock almost immediately, selling BTC as risk-off momentum picks up (coverage of the JGB trigger is outlined in this Cryptoslate report: JGB yield shock explanation).
Amplification (T0 + seconds→minutes): order books on major spot and derivatives venues were thin. Algorithmic market makers, facing heightened inventory risk, widen spreads or pull liquidity. Automated deleveraging routines on derivatives venues and cross-margin systems begin executing cascade liquidations.
Liquidation wave (T0 + minutes): a rapid string of long liquidations — documented at hundreds of millions in notional value — cascades across exchanges, shaving big chunks off price and triggering further stop-loss clusters and liquidity provision withdrawal (AmbCrypto documents the scale and speed of long liquidations).
Weekend retail pain point (T0 + hours→days): reporting indicates roughly 180,000+ traders faced liquidation across that weekend event, intensifying knock-on effects and retail drawdown (Blockonomi reports liquidation counts and retail pain points).
Post-event: markets reprice risk premia, funds and LPs re-evaluate hedges, and attention turns to how institutions and ETFs absorbed flows amid the volatility. Analysts later reconstructed the cascade as a domino effect enabled by market structure failures and mechanical stops (domino-effect narrative at Bitcoinist).
This sequence — macro shock → liquidity withdrawal → algorithmic repricing → liquidation cascade — is the simplest causal chain that fits the data and eyewitness accounts from exchanges.
Why thin liquidity and algorithmic flows amplified the move
Two structural facts made the move worse than it might otherwise have been: low available liquidity at prevailing prices, and the prevalence of models that trade on short-latency signals.
Order-book dynamics and liquidity holes
Spot order books showed sparse depth once price moved beyond the first set of resting bids. Market makers normally provide depth to absorb outsized flows, but when inventory risks spike (i.e., a correlated cross-asset shock), they widen quotes or step back entirely. That void exposed stop clusters and large derivative counterparties who required fills to deleverage. The result: a small market sell became a larger price-moving event.
Algorithmic and cross-venue flows
High-frequency strategies and liquidity-providing algorithms are not liquidity insurers in stressed conditions; they are liquidity takers when their risk limits bite. Many algos are trained to reduce exposure when volatility rises or when skew moves rapidly. Simultaneously, cross-venue execution (triangular arbitrage, basis trades between spot and perpetuals) can flip direction in seconds, turning localized selling into global pressure.
ETF flows and month-end fragility
ETF-related flows and month-end rebalancing matter because they concentrate notional into discrete windows; even sophisticated market participants schedule trades that can exacerbate directional pressure if liquidity is thin. With ETF flows scheduled and retail volumes low due to holiday timing, the market had fewer natural buyers to absorb the shock.
The liquidation cascade: mechanics and market consequences
Liquidations turned the price move into a self-reinforcing loop.
Perpetual futures with high leverage rely on mark-price-based margining and auto-liquidation. When mark prices gap, automatic deleveraging fires, forcing exchanges to fill positions at available market prices.
As each liquidation consumes liquidity, it pushes the mark and last prices lower, tripping more liquidations — classic positive feedback.
AmbCrypto and exchange dashboards recorded rapid, concentrated long liquidations totaling hundreds of millions in notional; Blockonomi put trader liquidations around 180k+ for the weekend event, a scale that signals significant retail pain and underscores how concentrated leverage was across venues.
Bitcoinist’s post-crash reconstructions show how a few large fills and margin calls can act as dominoes in this environment: once key levels break, structural order types (stop-loss ladders, funding-induced deleveraging) take over and amplify the path.
Consequences extend beyond PnL. Margin resets, fund deleveraging, and enforced deleveraging on centralized venues can reduce market-making capacity for hours to days, meaning subsequent shocks face even thinner liquidity.
Risk-management takeaways for traders and portfolio managers
This event’s lessons are practical and immediate.
Re-evaluate leverage budgets: if a market can cascade to trigger 180k+ liquidations in a weekend, your allowable leverage should assume material tail events. Size positions to survive 5–15% instantaneous moves without forced closure.
Use options for asymmetric protection: protective puts, collars, and calendar spreads offer defined risk. For portfolio managers, buying puts around macro event windows (policy announcements, bond auctions, major rebalancing dates) is a cost-effective way to buy time.
Mind venue and counterparty exposure: spreads and liquidation engines vary by venue. Know how your exchange calculates mark price and liquidations; cross-margining can shelter positions, while solo-margin amplifies liquidation risk.
Stagger execution of large flows: if you manage order flow (ETF or large spot trades), slice and schedule with a liquidity provider or liquidity-seeking algos instead of posting big market orders into thinned markets.
Monitor cross-asset signals: JGBs, FX, and rates moves can be lead indicators for crypto risk-off. Macro desks should pipeline rate and sovereign bond surprises into crypto hedging playbooks.
Stress test with order-book simulation: backtest leverage plans against historical flash crashes and synthetic order-book shocks to quantify liquidation probability.
Platforms that offer diversified ways to gain exposure, like installment and earn products on Bitlet.app, can also help investors reduce concentrated leverage and smooth exposures across time — but they are not a substitute for active hedging in stressed markets.
Practical trade and hedge ideas after the crash
Short-term put-buying: enter near-term puts around 1–3% out-of-the-money to protect recently accrued gains while you assess liquidity recovery.
Collar strategy: sell covered calls to fund protective puts if premium is elevated after the crash.
Volatility straddles across spot and derivatives: for tactical traders who expect more chop, buy straddles; for those expecting stabilization, sell straddles but size conservatively.
Basis and funding plays: if perpetual funding normalizes after systemic deleveraging, basis trades (long spot, short perpetual) can benefit; be mindful of funding spikes around macro events.
Capital preservation: reduce directional bet sizes and reallocate some risk budget toward cash or short-duration stable income until liquidity profiles improve.
Scenarios for December price action (practical triggers and trades)
Scenario A — Quick recovery (base case)
Trigger: Macro shock fades, JGB yields stabilize, and market makers re-enter. ETF flows provide structured buying and open interest rebuilds.
Implication: Spot recovers toward prior ranges within days; implied vol falls.
Trades: Buy dips with tight stops; consider short-dated protective puts to hedge.
Scenario B — Prolonged consolidation (probable under higher rates uncertainty)
Trigger: Macro uncertainty remains, but no new systemic shock. Liquidity stays muted through month-end.
Implication: BTC trades in a wider range, funding normalizes slowly, and directional conviction is costly.
Trades: Favor range strategies (iron condors, calendar spreads), harvest premium cautiously, and cut leverage.
Scenario C — Further downside (tail risk)
Trigger: Additional rate or sovereign risk shocks (another JGB-like event or FX crisis) or forced selling from large institutional deleveraging.
Implication: Renewed liquidation waves and structural buyers remain sidelined; extended drawdown possible.
Trades: Buy longer-dated puts, increase cash weighting, and use staged re-entry with limit ladders.
Final takeaways
- The crash was a textbook interaction of a macro trigger (JGB yield shock) and fragile market structure: thin books, algorithmic withdrawal, and concentrated leverage.
- Liquidation cascades matter because they aren’t just P&L events — they reshape liquidity provision and risk premia for days to weeks.
- Risk management must be structural: plan for macro cross-asset shocks, cap leverage, use asymmetric hedges, and simulate order-book stress.
For active traders and portfolio managers, the immediate priority is not predicting the next move but reducing exposure to mechanical risks (liquidations, venue-specific rules) and buying protection where suitable.
Sources
- CryptoSlate — JGB yield shock explanation: https://cryptoslate.com/150b-wiped-bitcoin-drops-below-87k-on-japan-yield-shock/
- AmbCrypto — scale and speed of long liquidations: https://ambcrypto.com/bitcoin-and-ethereum-crumble-647-mln-in-longs-vanish-overnight/
- Blockonomi — liquidation counts and retail pain points: https://blockonomi.com/bitcoin-btc-price-declines-5-as-180000-traders-face-liquidation-on-sunday/
- Bitcoinist — domino-effect reconstruction and market structure failure: https://bitcoinist.com/domino-effect-sell-off-analysts-reveal-the-spark-behind-bitcoins-flash-crash/
For readers wanting to dive deeper into market mechanics, consider monitoring order-book depth and implied vol term structure in real time and revisiting how ETF flows align with macro calendars and sovereign bond auctions. And if you’re exploring non-linear exposure or installment-style approaches to size into BTC over time, platforms such as Bitlet.app provide alternative execution profiles — but they should complement, not replace, active hedging.


