Anatomy of a BTC Short Squeeze: Derivatives Dynamics, Liquidation Risk, and a Trader’s Playbook
Summary
Executive overview — why derivatives still matter
Derivatives are the pressure valves of the crypto market. When large pools of perpetuals and futures stack on one side of the trade, small price moves can snowball into a cascade of liquidations. That’s the essence of a short squeeze: price moves trigger margin calls on shorts, forced buys push price higher, which triggers more liquidations, and so on.
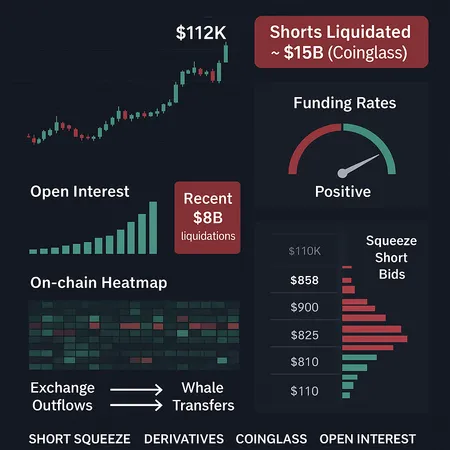
Two recent data points are key to follow right now. First, a Coinglass‑based estimate highlighted in recent coverage suggests roughly $15 billion of short positions would be vulnerable if BTC rallies toward the ~$112,000 area. Second, the market has already proved how nasty leverage flushes can be — reports show about $8 billion of open‑interest was recently wiped out in a fast deleveraging. Together, these figures show both the raw buildup on the short side and the market’s mechanical sensitivity to liquidation events. See the Coinglass summary for the short concentration and the futures open‑interest purge analysis for historical context.
For active traders and derivatives desks this is not academic: it’s a playbook. Below we unpack the mechanics of the squeeze, the on‑chain and funding signals to monitor, and scenario‑based risk management steps for desks that want to navigate — or exploit — a potential squeeze.
How ~ $15B of shorts near $112k creates a squeeze pathway
At its simplest: shorts are borrowing USD or BTC in futures/perps to sell now and buy back later. If the market ramps quickly, exchanges liquidate under‑collateralized short positions by buying in the spot/futures markets. If many shorts cluster around similar liquidation prices, exchange auto‑liquidations can create a large, concentrated buy volume — the classic squeeze.
The Coinglass estimate (covered in the market press) highlights a concentration of short notional around the $112k mark. That level becomes a mechanical choke point: once price action pushes through local resistance and into zones where leverage and margin profiles are thin, the orderbook can be eaten rapidly by exchange‑executed liquidations. Because forced buys do not place limit orders at smart prices — they execute against the best available liquidity — a wave of forced buys can gap price well beyond where discretionary buyers would have stepped in.
Why $112k matters from a structural standpoint: it’s both a round number and a technical resistance area on multi‑timeframe charts, so natural buy interest and short liquidation thresholds cluster there. The presence of sizable short exposure clustered at a round number makes a squeeze more likely to accelerate once the first tranche of stops and liquidation triggers executes. For traders who prefer a visual: recent technical work mapping resistance and target levels is useful context when sizing potential squeeze amplitudes.
(Reference: Coinglass concentration analysis and a technical BTC chart review provide useful corroboration.)
The recent $8B open‑interest purge: what that history implies
Markets have already been tested. Recent reporting shows roughly $8 billion in open interest was purged in a fast deleveraging episode. That event matters for two reasons:
- It proved the system’s sensitivity: when leverage is abundant, small net orderflow imbalances can force large, rapid re‑pricing as exchanges unwind positions. Traders who survived the purge did so by maintaining margin buffers or being short gamma-light.
- It changes behavior: exchanges and market makers adjust risk models after large liquidations (widened spreads, less committed liquidity, and stricter margin maintenance). That reduced liquidity can amplify the next move, because fewer resting orders exist to absorb sudden heavy buys or sells.
Leverage is not evenly distributed. Retail tends to dominate small tickets across many exchanges; derivatives desks and funds concentrate larger notional on particular venues. That concentration creates localized liquidity traps — exactly the environment where a $15B short stack around $112k could turn into a violent squeeze if liquidity providers step back.
(For a deeper read on the open‑interest purge and how leverage unwound, see reporting linked earlier.)
On‑chain and funding‑rate signals that distinguish a real squeeze from a fake breakout
Not every breakout that eats shorts is sustainable. Traders should combine funding‑rate dynamics with on‑chain and exchange data to build conviction.
Key signals to watch (and thresholds to consider):
Funding rates across major perpetual venues: a sustained positive funding spike (perp long pay) indicates traders are paying to be long — that’s a sign of persistent demand. Sharp, large positive funding moves during a price rally support a real squeeze. Conversely, if funding spikes briefly and collapses as price stalls, that may be a short‑covering pump without follow‑through.
Perpetual basis (spot vs. perp): a widening basis (perp trading at a premium to spot) suggests true buying pressure in derivatives markets. Watch for basis to remain elevated across multiple venues — cross‑exchange divergence is a warning sign that the move might be venue‑specific.
Open interest flow and aggregation: rising price with rising open interest is bullish (new longs). Rising price with falling open interest often means short covering — less durable.
Liquidation heatmaps and exchange book depth: concentrated liquidation levels and thin orderbooks mean forced buys will have larger price impact.
Exchange inflows/outflows and custody flows: large transfers from exchanges to cold wallets can indicate spot accumulation; the opposite (large inflows to exchanges) can precede selling pressure.
On‑chain metrics such as realized volatility, active address growth, and whale wallet activity: these corroborate whether participation is broadening beyond mechanically forced buys.
Putting these together: a likely sustained short squeeze will show (1) coordinated positive funding rates across platforms, (2) rising open interest with price, (3) widening perp basis, and (4) persistent on‑chain accumulation or fewer exchange sell offers. A fake breakout often shows explosive price and liquidations but with collapsing funding back to neutral, falling open interest, and no meaningful change in on‑chain accumulation.
(See the technical target and resistance mapping for context on where confirmation matters.)
Practical scenarios — three playbooks
Scenario A — Controlled squeeze (bullish, orderly): price drifts above resistance, funding rises slowly, open interest climbs as new longs enter, liquidity providers respond. How to act:
- Tactical long entries on pullbacks to VWAP/previous resistance turned support.
- Use scaled position sizing with clear stop limits; keep margin cushion >20–30% above maintenance for leveraged longs.
- Consider one‑leg long with small short call hedge (options collar) to cap tail risk.
Scenario B — Flash squeeze (violent, short‑covering driven): price gaps higher with large auto‑liquidations, funding flips positive for a short burst, open interest falls (shorts cover). How to act:
- Avoid dipping into breakouts blindly — wait 1–3 15‑minute closes above level and watch funding persistence.
- Liquidity can evaporate; use limit entries below immediate highs, not aggressive market buys.
- Reduce notional and gamma exposure; desks should temporarily reduce passive liquidity provision and widen spreads.
Scenario C — Fake breakout (pump and dump): price spikes, liquidations trigger momentary highs, but funding quickly neutralizes and open interest declines as longs unwind. How to act:
- Exit aggressive directional exposure quickly. If you’re long, use tight, rule‑based stops or delta‑hedge with spot sells or calls sold.
- For desks: switch to market‑neutral strategies (basis trades if basis remains profitable) or tighten margin buffers; avoid forcing coverage with high‑slippage market orders.
Desk and trader risk‑management checklist
- Monitor cross‑exchange funding and basis in real time. A persistent funding premium across venues is a stronger signal than a single exchange spike.
- Enforce hard position limits and dynamic margin buffers that rise with realized volatility.
- Keep an options toolkit ready: buying calls for protection or selling hedged structures can be cheaper than taking forced liquidations.
- Watch settlement windows on major exchanges and centralized venue maintenance updates; auto‑deleverage rules differ and can affect where selling pressure concentrates.
- Use TWAP/POV algos for larger fills and avoid aggressive market orders unless you accept slippage risk.
- Maintain a crisis liquidity pool (cash or unencumbered collateral) sized for worst‑case auto‑liquidation scenarios the desk could face.
- Coordinate with prime brokers and give them advance notice when you plan to ramp exposure — this can reduce surprise margin calls.
Mentioning tooling: traders monitoring these dynamics will combine on‑chain dashboards, funding feeds and CLOB depth; services like Bitlet.app are part of that modern toolset for managing positions and planning entries across spot and derivatives.
Execution signals and watchlist (operational)
- Funding Rate: watch both level and curve (1h, 8h, 24h averages).
- Open Interest: absolute notional and rate of change (ΔOI per hour/day).
- Perp Basis: cross‑exchange and skew across tenors.
- Liquidation Heatmaps: clustered price bands with high notional.
- Exchange Orderbook Depth: immediate liquidity at strike clusters.
- On‑chain Flows: exchange inflows/outflows and whale transfers.
Set alerts for: funding > 0.03–0.05% per 8h on multiple venues, OI spikes >5–10% in 24h, or concentrated liquidation bands within 5–10% of current price.
Final thoughts — trade the signals, not the narrative
A headline like “$15B of shorts around $112k” is powerful — but it describes potential energy, not inevitability. The market’s path depends on liquidity, funding dynamics, open interest behavior, and whether broader participation (on‑chain accumulation and new money) sustains the move. Past purges of open interest (the ~$8B event) are a sober reminder that leverage amplifies both directions.
For desks and active traders, the edge comes from disciplined risk controls, multi‑venue monitoring, and pre‑defined response plans for the three scenarios above. Know your liquidation points, keep margin buffers, and use hedges sensibly: in a market where forced mechanics can dominate, survival is an active strategy.
Sources


