AAVE Risk/Reward: When Whale Accumulation Meets Bullish MACD — Targets, Tactics, and Risks
Summary
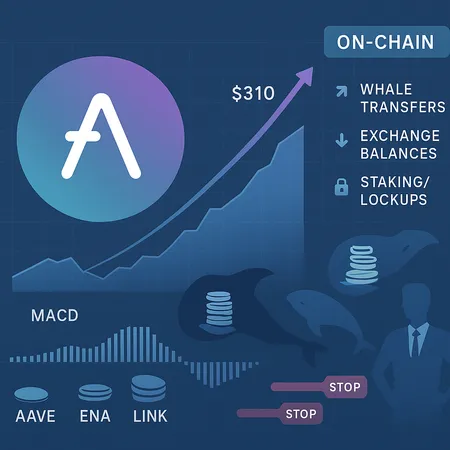
What’s changing for AAVE — what, why now, and why it matters
AAVE is catching attention because two forces are converging: technical momentum and on‑chain accumulation. Technically, recent studies flag a bullish MACD histogram expansion alongside market structure that suggests a reversal is underway; that thesis underpins a $240–$310 near‑term target band. At the same time, on‑chain reports point to significant whale buying—often the spark that converts technical momentum into rapid price moves.
This matters beyond AAVE holders. For many DeFi allocators and token traders, a decisive AAVE run would signal renewed altcoin rotation away from large‑cap defensive names and back into DeFi risk assets. Bitlet.app users tracking yield-bearing allocations should treat this as a potential opportunity window but also a test of concentration risk across protocols.
The technical case: why $240–$310 is on the table
A growing MACD histogram—where histogram bars rise above the zero line after a period of compression—is a classic early momentum signal. Technical analysts recently used that same read to justify upside for AAVE into the $240–$310 range; the case rests on two pillars: a momentum shift (MACD) and a durable support structure under price that limits downside for swing traders when used with stop discipline. See the technical breakdown in this price analysis for details on the indicator setup: AAVE price prediction and technicals.
Why those targets? They reflect a combination of measured move projections from the breakout base and prior liquidity clusters where stop orders and resting limit orders often concentrate. In plain terms: if the MACD bullish signal is confirmed by a breakout (higher highs with expanding on‑chain and on‑exchange volumes), the path to $240 is the first logical waypoint; $310 becomes achievable if momentum sustains and adverse liquidity drains (exchange balances falling, higher DEX depth) remain in place.
Key technical confirmation points
- MACD histogram: rising bars crossing zero with increasing momentum—early confirmation of trend reversal.
- Support structure: visible accumulation zones and moving average confluence that can serve as reliable stop anchors for swing positions.
- Volume & liquidity: breakout quality matters—higher traded volume and improved DEX liquidity strengthen the target thesis.
On‑chain whale accumulation: what the flows mean
Recent on‑chain reporting indicates whales are loading AAVE alongside ENA and LINK, showing a coordinated or correlated accumulation pattern among large addresses. Coverage of this behavior is summarized in this report on whale accumulation: whales loading ENA, LINK and AAVE.
Why is concentration important? Large holders can create a one‑way flow that compresses free float, making prices more sensitive to each marginal buy or sell. That raises two implications:
- Upside leverage: When a handful of addresses accumulate and liquidity is thin, relatively modest buy pressure can push price quickly toward technical targets.
- Volatility & tail risk: The same concentration increases the risk of sharp reversals if whales rotate out, take profits, or if forced deleveraging occurs in derivatives markets.
Concentration also modifies expected drawdown behavior—deep sell‑offs can be shorter but steeper, which affects how you size stops and use leverage.
How on‑chain supply interacts with derivatives and liquidity to set short‑term targets
Price discovery in AAVE will be a function of both who holds the supply and where leverage sits. Key dynamics:
- Exchange balances falling: fewer tokens on exchanges make squeezes easier and lift local price ceilings.
- Derivatives open interest & funding: long open interest growth combined with positive funding can accelerate rallies, while crowded longs create liquidation cascades on pullbacks.
- Liquidity depth: DEX and AMM pool depth at target bands determines how far a whale bid can push price without paying heavy slippage.
In practice, a coordinated whale accumulation event combined with rising open interest can be a bullish multiplier; it turns technical breakouts into momentum runs. Conversely, if derivatives positioning is skewed and funding spikes, any minor negative catalyst can unwind longs and create outsized downside.
Risk controls for DeFi allocators and tactical entries for traders
Different time horizons and objectives require different controls. Below are pragmatic guidelines for intermediate traders and allocators.
For yield-seeking DeFi allocators
- Position sizing: cap AAVE directional exposure to a modest share of risk assets (e.g., 2–6% of liquid portfolio) unless you can actively hedge.
- Yield vs directional split: consider maintaining yield exposure (staking or lending) for most tokens and allocating a smaller, tactical sleeve for directional AAVE upside.
- Hedging: use options or inverse perpetuals to create a cost‑effective hedge if tails would meaningfully harm portfolio drawdown.
- Lockups & liquidity: avoid locking large portions of AAVE in long lockups that prevent tactical rebalancing during high‑volatility moves.
For intermediate traders (swing & tactical)
- Entry strategies:
- Layered support buy: scale in across the identified support band rather than entering full size at once.
- Breakout + retest: enter on a confirmed breakout above resistance, ideally on a retest that holds support.
- Stop placement: use structure‑based stops (just below the accumulation zone or a specified percentage—commonly 8–15%—depending on volatility tolerance).
- Take‑profit plan: scale out—partial profit at the lower range of $240, further trimming nearer $310.
- Leverage: avoid high leverage during early accumulation phases; wait for confirmation of momentum to increase exposure.
Concrete trade example (illustrative, not advice)
- Size: 5% of trading capital allocated to AAVE directional swing
- Entry: 40% at current support band, 30% on breakout confirmation, 30% on momentum pullback
- Stop: 10% below the support band (adjust by volatility)
- Targets: partial take at $240, full or trailing stop approach toward $310
A concise monitor list — metrics to confirm or invalidate the thesis
Track these on‑chain and market indicators daily to decide whether to add, hold, or exit:
- Whale transfers: sudden large inbound transfers to centralized exchanges vs. accumulation into wallets. Repeated accumulation into non‑exchange wallets supports the bullish narrative.
- Exchange balances: net decreases in AAVE on exchanges (especially Binance, Coinbase) are bullish; spikes in deposits can signal sell pressure.
- Top‑address concentration: ratio of supply in top 10/100 addresses—rapid increases mean higher concentration risk.
- Staking/lockups: growth in locked supply reduces circulating float.
- DEX liquidity depth: available liquidity at key bands; low depth increases slippage and volatility.
- Derivatives open interest & funding rates: rising open interest plus positive funding suggests crowded longs (short‑term risk of liquidation).
- On‑chain transfer velocity & DEX volume: rising velocity with rising price indicates genuine demand vs. thin, pump‑style moves.
If multiple metrics diverge—for example, bullish MACD but rising exchange balances and negative on‑chain accumulation—the thesis is weakened and should be downgraded.
Final checklist before committing capital
- Confirm MACD histogram continuation and a clean breakout (volume/DEX depth supportive).
- Verify sustained whale accumulation that is not simply exchange‑to‑exchange churn.
- Check derivatives: manageable open interest and neutral/positive funding (not extreme positive).
- Set stops and size for concentration risk; consider hedges for allocators.
If those checks line up, the risk/reward to $240–$310 looks reasonable for tactically sized positions. If they don’t, patience or hedged exposure is the prudent path.
Conclusion
AAVE’s current setup is a textbook example of where technicals and on‑chain supply dynamics intersect to create asymmetric opportunities—and asymmetric risks. A bullish MACD histogram and supporting structure give a credible roadmap to $240–$310, but the real story will be written by large holders and derivatives flows. Intermediate traders should prefer scaled entries, structure‑based stops, and explicit profit plans; DeFi allocators should limit directional exposure and consider hedging to protect yield strategies.
Monitor the metrics listed above, stay disciplined on sizing, and let confirmation, not hope, drive additions. For tools and tracking relevant on‑chain metrics and liquidity analytics, platforms like Bitlet.app can help you keep allocations and risk in check.
Sources
- AAVE price prediction: targeting $240–$310 range as technicals flip bullish
- Altcoin rally: whales loading ENA, LINK and AAVE, on‑chain accumulation evidence
For additional context on DeFi rotation and related tokens, see reporting on Aave and broader DeFi trends within the ecosystem.


