Has Bitcoin Found a Bottom? A November 2025 Tactical Guide
Summary
Executive snapshot
Bitcoin’s late‑November consolidation is a fork in the road: one camp sees a structure that looks like a bottom — a higher low above an ascending trendline and rolling moving averages — while another warns this could be a short-lived bounce in a larger downtrend. The derivatives calendar adds fuel: a large monthly options expiry looms and could amplify volatility and direction through so‑called max‑pain dynamics. This piece parses the technicals, on‑chain flows and funding signals, then offers concrete scenario-based trade frameworks and a practical 30–90 day monitoring checklist.
What price action is telling us now
Price has spent recent days consolidating above an ascending trendline that began during the earlier pullback. That structure is what bullish analysts point to when they say BTC may have formed a base: instead of a clear break to lower lows, the market has carved a series of higher intraday lows while volatility contracted. Several market pieces argue the correction may have run its course and cite this consolidation as evidence for example, CryptoDaily’s recent piece on Bitcoin forming a bottom.
At the same time, commentators and veteran traders urge caution. Legendary trader Peter Brandt has warned this move bears hallmarks of a possible dead‑cat bounce rather than a sustainable reversal, a useful reminder that early rallies inside a longer correction often fail to sustain if liquidity and participation aren’t broad-based (see the warning covered by Coinpaper).
Key short‑term structure to watch
- The ascending trendline: holds = structural improvement; break = risk of renewed leg down.
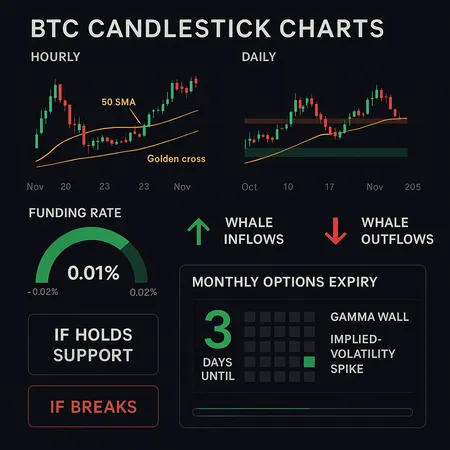
- Daily closes relative to the 50‑ and 200‑day moving averages: the relationship between these MAs still frames tactical bias (does the 50‑day grind back above the 200‑day for a golden cross or fail and confirm resistance?).
- Volume profile: diminishing selling volume through the dip + rising bid liquidity is bullish; large spikes in sell volume on down closes are not.
Technical indicators — what they mean here
Moving averages provide a clean rule set for intermediate traders. If the 50‑day MA begins to slope up and daily candles close above it consistently, momentum is returning. A sustained 50/200 golden cross would strengthen the bullish narrative, but a cross is not a guarantee and can lag price. Conversely, the dead‑cat scenario looks like an intraday pop above a short MA followed by heavy distribution and a decisive break below the trendline and the 50‑day.
If you prefer rules: treat a daily close above the 50‑day as a conditional green light for idiosyncratic buys (with size limits), but require the ascending trendline to hold on pullbacks to consider scaling into larger positions.
On‑chain flows and whale activity — mixed messages
On‑chain data offers nuance. Several reports indicate smaller wallets have been accumulating the dip, which can be a sign of retail accumulation and longer‑term conviction. However, whale flows are not unequivocally bullish: there are signs of large holders selling into strength, which could create supply pressure if sustained. CryptoPotato highlighted on‑chain whale behavior suggesting that while accumulation is happening at smaller levels, larger holders may still be distributing — an important tension for near‑term price action.
A widening funding gap and related funding‑rate dynamics add to the complexity. If funding rates remain elevated (positive for longs), short‑squeezes can cause sharp rallies — but when the funding gap widens the other way, leveraged longs can be crowded out quickly. Blockonomi’s analysis of funding gaps details how these pressures can increase vulnerability for strategy holdings and ripple into liquidity stress.
Derivatives: the looming monthly options expiry and why it matters
The options market is particularly relevant right now. The monthly options expiry is large — headline coverage shows a significant $13.3B monthly expiry — and expiries this size concentrate open interest and create max‑pain dynamics that can bias price toward strike clusters leading into expiry. Coindesk’s piece on the $13.3B expiry explains how expiring positions and large max‑pain points can amplify volatility and directional push as traders adjust and delta‑hedge.
What to expect: when open interest clusters near particular strikes, market makers hedge dynamically and delta flows can create persistent buying or selling pressure. If the largest concentration aligns with current price and liquidity is thin, we might see sharp moves into or away from those strikes in the 48–72 hours around expiry.
How to read the mixed tape: three practical scenarios
Below are pragmatic scenario frameworks that tie technicals, on‑chain flows and the options calendar into tradeable plans. Replace "X" with your current consolidation low or the ascending trendline level on your chart.
Scenario A — Base confirmed (Bullish): BTC holds X support and volume improves
- Conditions: price respects ascending trendline (X), daily closes repeatedly above the 50‑day MA, funding rates moderate or flip negative (reducing leverage risk), and whale net flows are neutral to slightly inflow.
- Likely path: options delta flows around expiry add transient volatility but the trend resumes higher as buyers absorb distribution.
- Trade framework: scale in 25–50% of intended position on the first confirmation (daily close above 50‑day), add on successful retest of trendline (stop if price closes below trendline by >2–3%), size positions so max drawdown is <6–8% of risk capital.
- Risk tools: small protective puts or short‑dated hedges around expiry; time entries to avoid the 24–48h window before/during expiry if you want to reduce chop exposure.
Scenario B — Chop and range (Neutral): BTC oscillates around X, options expiry dictates short bursts
- Conditions: price flirts with trendline, moving averages are flat, funding rates oscillate, whales alternate between minor sells and buys. Options expiry causes spikes but no clean trend follows.
- Likely path: sideways trading with occasional intraday thrusts; liquidity providers and market makers dominate direction into and out of expiry.
- Trade framework: favor mean‑reversion trades (range buys/sells), avoid large directional bets, keep tight risk limits (2–4% stops), and reduce leverage. Consider building positions via dollar‑cost averaging (DCA) over weeks rather than one‑time entries.
Scenario C — Break lower (Bearish): BTC loses X decisively
- Conditions: decisive break below trendline on high volume, 50‑day fails to hold and heads toward the 200‑day, whale outflows increase, funding gap widens to the downside and open interest drops as longs get liquidated.
- Likely path: quick retracement to lower support pockets as forced selling and margin stops cascade.
- Trade framework: close or sharply reduce directional long exposure, add tactical short exposure only if you can manage margin and gamma risk through expiry. For those wanting exposure: re‑enter via scaled buys only after a clear capitulation signature (volume spike, high exchange inflows, on‑chain outflows drying up).
- Risk tools: avoid naked exposure into expiry; consider using inverse ETFs or futures hedges sized conservatively.
Practical 30–90 day monitoring checklist (what to watch and why)
Use this checklist daily/weekly to keep decisions data‑driven:
- Trendline integrity: daily closes relative to the ascending trendline — primary binary read.
- Moving averages: 50/200 daily MA crossover dynamics; watch for slope changes.
- Volume on moves: rising volume on up days vs rising volume on down days — which is larger?
- Funding rates & open interest: look for large swings in funding rates or a rapid drop in open interest (liquidation and deleveraging signals). Blockonomi’s writeup on funding gap behavior helps explain why this matters.
- Options: monitor open interest clusters and max‑pain concentrations into expiry (Coindesk’s coverage shows expiry sizes and implications). Watch the 72‑hour window closely.
- Whale flows & exchange activity: big exchange inflows (sellers) vs outflows (hodling); CryptoPotato’s piece is a good primer on interpreting whale signals.
- Liquidation clusters and on‑chain demand: are small wallets accumulating? Are exchanges seeing net deposits or withdrawals?
- Macro cues: risk‑on/risk‑off moves in equities and rates backdrop; large macro moves often amplify crypto option hedging flows.
Risk and position sizing rules for intermediate traders
- Default sizing: risk no more than 1–3% of portfolio value on any single trade unless you have robust hedges.
- Use stop losses tied to technical structure (e.g., below trendline or below a daily close level), not arbitrary percentages.
- Prefer scaling in with staggered entries and hurt‑proof averaging rather than all‑in buys.
- If holding through the options expiry, reduce size or hedge — expiries can create short‑term squeezes that invalidate stop orders.
A few tactical trade examples (illustrative)
- Conservative buy: DCA 4 equal tranches over 6–8 weeks while trendline holds; set a hard stop if price closes back below trendline with >5% gap.
- Tactical swing: Buy 25% position on daily close above 50‑day MA; add 25% after a clean retest of the trendline. Cap total exposure to 2% portfolio risk.
- Hedge play for expiry: Hold core spot; buy short‑dated OTM puts sized to protect a portion of position during the 48h window surrounding expiry.
Final read — probability, not certainty
The current consolidation has the shape of a bottom for the bulls: ascending trendline, reduced volatility, and some retail accumulation. But important contra signals remain — whale selling, a widening funding gap, and the ever‑present risk that the monthly options expiry will exacerbate volatility in whichever direction net hedging flows push. That mix argues for probabilistic thinking: conditions favoring a durable bottom exist, but they are not yet decisive without trendline confirmation, improving funding dynamics, and clearer whale behavior.
For intermediate traders: prioritize process over hope. Use clear rules tied to the trendline and moving averages, respect the expiry calendar, and size positions so one unexpected expiry‑induced swing doesn’t derail your risk profile. If you prefer a non‑directional way to participate, dollar‑cost averaging or small, incremental buys while maintaining discipline often outperforms trying to time the exact bottom.
Bitlet.app can be a practical platform for investors who favor installment buys and want to reduce timing risk through regular purchases, but whether you use DCA or tactical entries, keep stops and hedges in place around high‑volatility windows.
Sources
- Bitcoin forming a bottom? Full price analysis — CryptoDaily
- Is this the bottom? Bitcoin steadies after 7‑month low — DailyCoin
- Bitcoin faces $13.3B monthly options expiry — CoinDesk
- Funding gap widens — Blockonomi
- Did Bitcoin bottom at $80K? Whale activity suggests more pain possible — CryptoPotato
- Peter Brandt issues Bitcoin warning — CoinPaper


