How ETF Outflows, Miner Selling and Fed Rate Expectations Compound BTC Price Risk — A Flow-Driven Roadmap
Summary
Executive summary
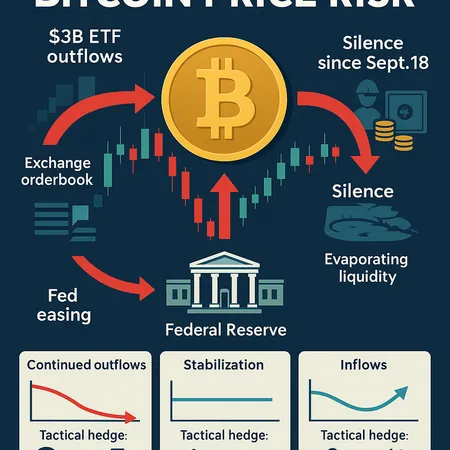
A concentrated decline in ETF demand — documented as roughly $3 billion of outflows — has drained a major on‑ramp for institutional BTC allocation and amplified price sensitivity to supply sources like miners. At the same time, research shows no new corporate Bitcoin treasuries since Sept. 18 while miner selling has picked up, compounding near‑term supply pressure. Meanwhile, markets are repricing monetary policy: Fed rate‑cut odds have spiked, which could flip liquidity back into risk assets if realized, but the timing is uncertain and velocity matters.
This piece maps the causal links between flow drivers and BTC price risk, lays out three scenarios (bear, base, bull) with probabilities and time horizons, and recommends tactical hedges and positioning frameworks for institutional allocators and advanced traders who want a structured, flow‑driven playbook.
What the data says: ETF outflows, miners and corporate buyers
ETF flows matter because they represent durable, programmatic demand from institutional pools of capital. Recent reporting documents about $3B of cumulative outflows from Bitcoin ETFs amid an intensified sell‑off, signalling the withdrawal of a major buyer cohort that had supported BTC prices throughout 2023–2024 (CryptoUpdates).
Separately, analysis shows no new corporate BTC treasuries since Sept. 18, while miner selling has increased — a double hit: corporate demand (a potential long, strategic bid) is quiet and miners are turning more supply loose into spot markets to meet operational costs or to rebalance risk (CryptoSlate). That dynamic amplifies downside when ETF demand reverses or pauses.
On the macro side, markets sharply repriced rate expectations in a short window: Fed rate‑cut odds doubled overnight in some coverage, changing the backdrop for risk assets including BTC (CoinPaper). Commentators argue that if rate cuts materialize, liquidity could return to digital assets — but that is conditional on the timing and scale of policy easing (CoinPedia).
For many allocators, Bitcoin still functions as a macro‑sensitive risk asset: flows and liquidity dominate short‑term moves more than fundamentals like on‑chain activity.
Causal map: how flows and macro expectations interact to create price risk
ETF outflows => liquidity drain
- Programmatic ETF selling converts large, patient pool allocations into marketable supply. When inflows flip to outflows, liquidity that supported tight bid‑ask spreads disappears and order book depth thins.
Thinner liquidity => larger price impact per dollar sold
- With lower depth, identical sell volumes move price further, attracting stop losses and feeding algorithmic deleveraging.
Miner selling adds to floating supply
- Miners are natural sellers; when their selling picks up it temporarily increases circulating supply available to meet ETF redemptions and retail selling.
Corporate treasury silence removes a potential structural bid
- Corporates buying BTC act as durable demand. Their absence removes a backstop that could absorb ETF and miner‑led supply surges.
Macro rate expectations modulate flow direction and velocity
- Higher odds of Fed cuts typically lower real yields and can re‑risk portfolios, potentially flipping ETF flows from neutral/negative to positive. But speed matters: a slow, anticipated easing may be priced in; a sudden acceleration in probability can trigger quick repositioning and an abrupt return of liquidity.
Feedback loops
- Price weakness can force derivative deleveraging, magnifying selling and further widening basis/funding. Conversely, an abrupt inflow wave into ETFs post‑cut could compress funding and squeeze shorts, accelerating rallies.
Together, these linkages mean BTC price risk is now more flow‑dominated: relatively modest net flows can produce outsized price moves because structural bidders are thin.
Scenario framework and BTC trajectories (3–12 month lens)
Below are three plausible scenarios with assumptions, triggers, liquidity dynamics and approximate directional outcomes. These are flow‑driven frameworks — not absolute price forecasts — intended to help size hedges and set risk limits.
Bear scenario (30% probability, 3–6 months)
Assumptions: ETF outflows continue or accelerate; miners maintain elevated selling to meet capex and fiat obligations; corporate buyers remain sidelined; Fed stay‑hawkish or delay cuts.
Liquidity dynamics: Persistent net selling overwhelms thin order books; funding turns positive for shorts; derivatives deleveraging amplifies downside.
Price implication: High risk of a meaningful drawdown as flows dominate — think acute downside compression (conditional range: -25% to -45% from current spot over 3 months). This path is characterized by episodic liquidity gaps and increased tail risk.
Triggers to move to this view: consecutive ETF outflow weeks totaling several billions, rising exchange balances, miners increasing weekly sell volumes and lack of corporate announcements.
Base scenario (50% probability, 3–9 months)
Assumptions: ETF outflows taper but do not reverse immediately; miner selling normalizes as BTC price stabilizes; corporate treasuries stay quiet but monitoring continues; Fed signals a gradual easing timetable and rate‑cut odds drift higher but without a surprise.
Liquidity dynamics: Net flows are near neutral — episodic volatility but no severe depth collapse. Market absorbs supply with wider spreads and occasional funding volatility.
Price implication: Rangebound or modestly lower BTC in the near term (conditional range: -10% to -25% within 3 months), with potential for recovery if macro easing becomes clearer in 6–12 months.
Triggers to move to this view: ETF flows flattening, miners reducing weekly sell rates, stable or falling exchange inventories, and a steady rise (not spike) in cut odds.
Bull scenario (20% probability, 6–12 months)
Assumptions: A clear Fed easing cycle with realized cuts or explicit forward guidance removes tail‑risk premia; ETF flows flip to inflows as institutions chase yield/risk; corporate treasuries re‑enter strategically; miner sell pressure abates.
Liquidity dynamics: Inflows into ETFs and spot markets rebuild depth quickly; funding rates compress and shorts get squeezed; a feedback loop of velocity and FOMO can accelerate gains.
Price implication: Convulsive upside replaying prior expansion phases (conditional range: +15% to +60% over 6–12 months), though higher volatility accompanies the regime shift.
Triggers to move to this view: Confirmed Fed easing with market‑surprising cadence, several weeks of ETF inflows, public corporate allocation announcements, and reduced miner sell pressure.
Tactical hedges and positioning strategies for allocators and advanced traders
Below are targeted, practical strategies — ranked roughly from conservative to tactical — that institutions and advanced traders can adapt depending on scenario probabilities and risk budgets.
1) Dynamic collar for institutional exposure (conservative)
- Construct a collar: hold spot BTC or BTC allocation, buy puts at a chosen downside (e.g., -20% over 3–6 months) and finance by selling calls at an upside cap.
- Rationale: Caps maximum drawdown while allowing upside participation; cost‑effective when implied volatility is elevated.
2) Staged, liquidity‑aware rebalancing (portfolio management)
- Scale positions in tranches tied to flow triggers (ETF flow stabilization, exchange inventories falling). Avoid large one‑time reallocations when market depth is thin.
- Rationale: Reduces execution slippage and avoids being the marginal buyer in a fragile liquidity environment.
3) Futures basis and calendar spread plays (relative value)
- If ETFs continue to outflow and spot weakens, watch the basis (spot vs. perpetual/futures). A steepening negative basis can be exploited by long spot, short futures (basis trade) if you can hold funding costs, or by entering calendar spreads.
- Rationale: Capture dislocations between funding rates and expected spot moves, but monitor margin and tail risk.
4) Put spreads and short dated protection (tactical)
- Buy cheap out‑of‑the‑money puts or vertical put spreads for targeted downside protection (shorter tenors if cost is a concern). Combine with buys at scale after confirmed liquidity improvements.
- Rationale: Cost contained while maintaining asymmetric downside protection.
5) Short tactically using options or futures (active trading)
- Skilled traders can use inverse ETFs, futures shorts or options-based bearish structures when clear flow signals appear (e.g., multi‑week ETF outflows + rising miner sales + technical break). Keep sizing disciplined and avoid uncovered naked positions.
- Rationale: High conviction trades can profit from flow catalysts but carry margin and gamma risk.
6) Use strategic overlays for yield/hedge efficiency
- Use buy‑write strategies (covered calls) on spot holdings to collect premium during rangebound periods; consider structured products that offer partial downside protection in exchange for capped upside.
- Rationale: Income generation during low‑flow windows offsets carrying costs.
Practical implementation notes
- Prioritize liquidity: execute large blocks via OTC desks or with algorithmic execution that seeks passive liquidity. Avoid market orders into thin books.
- Monitor funding and margin: derivative hedges require active margin management; sudden deleveraging events can produce cascading losses.
- Cost/benefit: Weigh the premium cost of protection against the allocation’s risk tolerance and the scenario probability profile.
Platforms such as Bitlet.app provide tools for institutional flow — but ensure you vet counterparty and execution capabilities for large, programmatic trades.
A compact monitoring checklist (signals & thresholds)
Watch these on a daily/weekly cadence and assign internal thresholds that trigger rebalancing or hedging actions:
- ETF flows (weekly): Outflows totaling >$1B over rolling 2 weeks = elevated risk; sustained outflows >$3B = high alarm.
- Exchange net flows & balances: Rising exchange balances >5% week/week suggest rising supply pressure.
- Miner selling rates: Weekly BTC sold by miners increasing vs. 4‑week average by >20%.
- Corporate activity: Any corporate treasury announcement or confirmed new allocations merit raising the bid thesis.
- Fed rate‑cut odds (CME FedWatch, options markets): A sudden doubling of cut odds in a short window increases bull odds; gradual drift requires patience.
- Derivative markers: Funding rates, basis, and open interest spikes signal positioning extremes.
Set automated alerts for combinations (e.g., ETF outflows + rising exchange balances) rather than single signals alone.
Conclusion — risk is now flow driven, not just fundamental
The recent $3B ETF outflows, higher miner selling and the absence of new corporate treasuries have removed a durable bid from BTC markets and raised the sensitivity of price to net flows. A parallel macro repricing — rising Fed rate‑cut odds — introduces a binary element: if easing arrives quickly, liquidity could rush back and squeeze short positions; if it does not, continued liquidity stress could deepen drawdowns.
For institutional allocators and advanced traders the right response is structured, conditional: size risks to flow scenarios, prefer staged execution, use collars or short‑dated protection to control tail risk, and monitor concrete signals rather than narratives. Keep an eye on ETF flows, miner behaviour and macro catalysts — they will continue to define near‑term BTC price trajectories.
Sources
- 3B outflows slam Bitcoin ETFs amid intensifying sell‑off — TheCryptoUpdates
- No new corporate BTC treasuries since Sep. 18; buyers vanish as miners sell — CryptoSlate
- Fed rate‑cut odds just doubled overnight — here’s what it means for Bitcoin — CoinPaper
- Bitcoin likely to remain under pressure as massive ETF outflows shake the market — CoinPedia