XRP at a Crossroads: Chart Levels, Liquidation Risk, ETF Hype and What Traders Should Watch
Summary
Where we are: the month-long downtrend and the $2 pivot
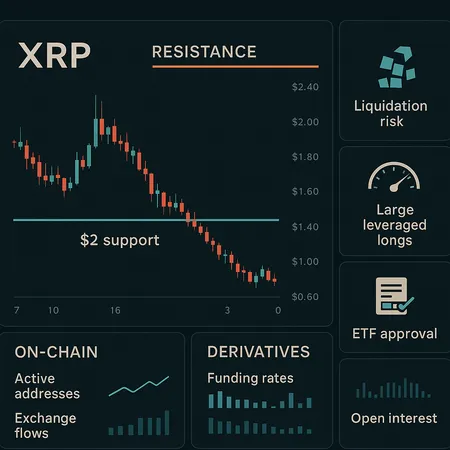
For many traders, XRP feels like it’s balancing on a razor. Price has carved a clear month-long downtrend: lower highs and lower lows with a series of failed breakouts into key resistance clusters. Over the past four weeks, buyers have repeatedly defended the $2 area, making it the tactical pivot between a continued grind lower and any meaningful reversal attempt.
Sentiment matters here—$2 is both a psychological and technical line. On shorter timeframes the structure is bearish: trendline resistance above, moving-average congestion, and rolling sell-pressure on bounces. But the repeated defense of $2 (noted in recent market updates showing buyers guarding that level) means a decisive break either way will likely trigger rapid follow-through in the corresponding direction. See the short update documenting the $2 defense for context: [buyers defending $2 support] (https://coinidol.com/xrp-amid-decline/).
Resistance clusters, targets and the bearish retest thesis
If bulls want to flip narrative, they first need to clear a defined resistance cluster that runs roughly from the mid-$2s into the low $3s (exact bands vary by timeframe). Above that sits the 50–200 moving-average confluence and prior breakout zones that would make a retest of $4+ sensible as a medium-term target.
Conversely, the bearish path is clear: a breakdown below the $2 pivot opens room for a deeper retest. Some technical analysts warn of a possible revisit to about $1.65 if bearish momentum accelerates and key supports fail — a scenario that would represent a classic bearish retest after selling pressure intensifies. For detail on that technical view, see the analysis outlining the $1.65 downside case: bearish retest to $1.65 may come soon.
Liquidation risk: the ticking clock on leveraged longs
Structure and leverage are inseparable in crypto—especially when a handful of large positions dominate the risk profile. On-chain and derivatives trackers recently flagged a roughly $96 million long that has suffered significant unrealized losses and sits dangerously close to liquidation. Heavy margin bleed from such positions can convert a controlled pullback into a cascading sell event as stop-losses and automated liquidations get pulled into order books.
This concentrated leverage is more than noise. A stressed long can trigger a wave of forced selling that pushes price through technical supports, creating the environment for a deeper retest. See the liquidation-focused note here: large $96M XRP long suffering losses and liquidation risk. Traders need to respect how quickly derivative markets can amplify on-chain signals.
Headlines vs. fundamentals: ETF chatter and the utility argument
Bullish narratives have returned to the table: talk of ETF approval has a proven ability to lift sentiment across altcoins and XRP specifically, as ETF narratives funnel fresh capital and media attention into the market. Reports explaining how ETF approval chatter can strengthen price and investor sentiment are circulating and, in the near term, can provide a material bid: XRP ETF approval talk can strengthen price.
Yet headlines are not a substitute for utility. Several market commentators and investors have argued that price moves without improving on-chain utility are fragile—short-term pumps fade if real adoption and use cases don’t follow. That long-term view is articulated here: price talk means little without real utility. In practice, ETF chatter can spark rallies and squeeze leveraged shorts, but sustainable valuation gains usually require measurable on-chain activity, partner integrations or clear revenue accrual to the token's ecosystem.
Reading on-chain and derivatives in tandem
On-chain flows alone can mislead you; derivatives alone can exaggerate moves. The best read combines both: monitor exchange inflows/outflows, large wallet activity, funding rates, open interest, and liquidation clusters simultaneously. Rising exchange inflows and spiking open interest with skewed funding toward longs is a red flag—bullish piling into leverage can be cut down quickly by a small downside wick.
Conversely, falling exchange balances, steady or negative funding rates and decreasing open interest during a pullback can indicate capitulation and an opportunity for selective buying. Use aggregated liquidations and large-position trackers to time your entries; the $96M long episode is a prime example of why watching liquidation clusters matters. Also pay attention to on-chain signs of real activity—transaction growth, active wallets, and utility-related transfers—which lend staying power to any headline-driven rally.
Practical risk-management and trade setups for intermediate traders
Risk management should be operational, not theoretical. Start with precise level-based sizing: determine how much you can lose to a break below $2 (or your chosen invalidation level) and size the position so that loss aligns with your risk tolerance (commonly 0.5–2% of portfolio per trade for many active traders). Use stop-losses, but place them outside noise—not right under obvious wick zones that stop-hunters can trigger.
Trade ideas:
- Defined-risk long: buy a fractional position on a clear micro-structure bounce off $2 with a stop below $1.90, target the mid-$2s first, then scale out into resistance.
- Short / hedge: if price breaks $2 decisively on high volume and open interest spikes, consider a short or options hedge with a target into $1.65, sizing to allow for volatility.
- Neutral income: sell premium (options) or use spreads that profit from range-bound behavior between $2 and mid-$2s—this reduces directional exposure but requires experience and margin.
- Use tight timeframes for execution but larger timeframes for context; trade entries on shorter frames while respecting daily/weekly structure.
Also plan for the leverage tail-risk: if you hold a directional position, consider a small opposite-leaning hedge (inverse perpetual, short futures slice, or put options) to protect against sudden liquidation cascades.
What to watch next: checklist and signals that matter
- Level map: $2 support (watch for reclaim or decisive break), resistance band in mid-$2s to low $3s, downside target ~$1.65 on accelerated selling.
- Derivatives: open interest, funding rates (sustained positive funding with rising OI = vulnerability), and liquidation heatmaps.
- On-chain: large transfers to exchanges, spikes in active addresses, or upticks in utility-related flows.
- News catalysts: credible ETF approval developments and regulatory updates; verify source quality before reacting.
- Volume and volatility context: breakouts with low volume are suspect; moves on higher-than-average volume have a better chance to follow through.
Bottom line
XRP is at a genuine crossroads where technical structure, concentrated leverage and headline cycles collide. Short-term upside is possible on ETF chatter or a clean reclaim of mid-$2s, but the presence of large leveraged longs and historically fragile rallies means risk remains elevated. Intermediate traders should combine on-chain and derivatives signals, size positions with explicit stop logic, and treat any ETF-driven rally as a sentiment amplifier—not proof of sustained utility.
Be pragmatic: watch the $2 hinge, respect the liquidation landscape, and let clear structure guide entries. For platform-specific execution and risk controls, traders on Bitlet.app should ensure leverage settings and stop rules match the scenarios outlined above.