How US Spot Bitcoin ETF Flows Amplified November’s Crash: Arbitrage, Custody and Passive-Flow Risks
Summary
Executive overview
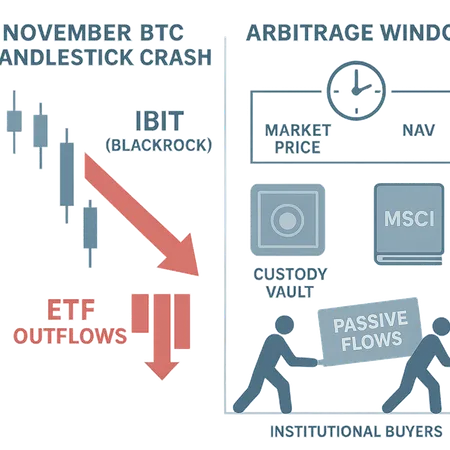
November’s sell-off in BTC was notable not just for the price action, but for how US spot Bitcoin ETF flows interacted with market microstructure to deepen the move. Data show record ETF outflows that month, with BlackRock’s IBIT accounting for a meaningful share of withdrawals. Those outflows did not occur in a vacuum: arbitrage frictions, retail-driven volatility, custodial settlement constraints and shifting passive-allocation signals (including MSCI rule changes) combined to create larger-than-normal basis swings between ETF prices and BTC spot.
For many traders, Bitcoin remains the primary bellwether, but the ETF wrapper introduces new plumbing — authorized participants, custodians, creation/redemption mechanics — that can convert a passive product into an amplifier when liquidity thins.
What happened in November: the facts and the flow story
Cointelegraph documented record November outflows from US spot Bitcoin ETFs, noting that BlackRock’s IBIT drove the majority of withdrawals. The headline numbers matter because ETFs are large, concentrated conduits for passive demand: when big ETF holders move, the underlying market feels it fast.
At the same time, media and institutional research flagged two reinforcing dynamics:
ETF arbitrage windows widened as intraday retail volatility spiked, increasing the cost and risk of maintaining tight ETF/spot parity. BeinCrypto’s primer on ETF arbitrage highlights how retail volatility can push spreads wider and strain liquidity during big moves. BeinCrypto overview of ETF arbitrage and retail volatility.
Structural risk to passive flows emerged from index rule changes. A recent MSCI decision raised questions about billions in potential passive flows and could change how institutional allocators — and funds tied to benchmarks — weight BTC exposure. CoinPaper’s coverage explains how MSCI rule changes can reroute passive capital and put certain institutional allocation strategies under pressure. MSCI rule-change analysis.
These developments came against a backdrop of heterogeneous institutional behaviour: while some funds pulled back, other large investors — for example, Abu Dhabi — increased their IBIT exposure despite interim losses, showing divergent time horizons and risk appetites. AltcoinBuzz on Abu Dhabi’s IBIT moves.
ETF mechanics 101 — why creation/redemption matters for BTC price formation
Spot Bitcoin ETFs trade on exchanges like any equity fund. But the arbitrage mechanism linking ETF price to underlying BTC depends on a small set of institutional participants and physical custody of coins.
Authorized Participants (APs): APs create and redeem ETF shares by exchanging baskets of underlying BTC (or cash) with the ETF sponsor. APs arbitrage price discrepancies by buying BTC when the ETF trades at a premium and selling ETF shares, or vice versa when a discount appears.
Custody and settlement: For a spot ETF, the sponsor’s custodian must accept or release BTC. Transfers can be operationally heavy — especially during times of network congestion or when custodians impose stricter controls.
NAV vs market price: The ETF reports a Net Asset Value (NAV) based on the underlying BTC holdings. When market liquidity is ample, the ETF market price closely tracks NAV through AP arbitrage. When liquidity is thin or risk-averse APs step back, spreads can widen, creating an arbitrage window.
What is an arbitrage window and why does it widen?
An arbitrage window is simply the price gap (and transaction cost/risk threshold) where triangular trades between spot BTC and ETF shares are not profitable or are too risky to execute. It widens when:
- Spot liquidity evaporates (order books thin, depth falls).
- APs face balance-sheet or operational constraints (e.g., they cannot source BTC quickly, or they are wary of settlement risk).
- Market volatility increases, raising the risk premium for executing multi-leg trades.
When the window widens, ETF prices can trade at persistent premiums or discounts to NAV. That dislocation feeds back into spot markets: if the ETF trades at a discount and APs initiate redemptions, the custodian must release BTC, which can add sell-side pressure into a weak market.
How arbitrage and retail volatility interact with ETF mechanics to amplify crashes
Retail traders — who often act fast and with smaller risk tolerances — can widen intraday volatility. BeinCrypto’s analysis shows how retail activity can expand spreads and strain arbitrage. During a sell-off, retail panic can push ETF intraday pricing away from NAV faster than APs can close the gap.
Consider this simplified chain in November’s stress:
- Large holder (or group of holders) decides to redeem ETF shares — either to take losses, rebalance, or meet liquidity needs.
- Redemption pressure forces the ETF custodian to prepare BTC transfers or cash settlements. If many redemptions cluster, the custodian/AP network must source significant BTC quickly.
- Spot liquidity is thin; selling larger blocks moves the market, causing volatile price swings that in turn widen ETF/spot spreads.
- Wider spreads disincentivize APs from stepping in (execution risk and funding risk grow), increasing the likelihood that ETF redemptions translate into net spot selling rather than neutralizing arbitrage trades.
The net effect: a redemption spiral where ETF outflows translate into spot selling into an already fragile market, thereby amplifying the drop.
Custody constraints and settlement friction — the hidden plumbing
Custody is not just safekeeping. Custodians control operational flows, AML/KYC checks, transfer limits and timing. During stress:
- Transfer limits and manual review can delay BTC delivery; delayed settlement creates execution risk for APs who may be called to deliver or receive coins.
- Network congestion on-chain increases gas costs and confirmation times; some custodians avoid risky on-chain moves during extreme volatility.
- AP balance-sheet and prime-broker relationships can be strained; when funding markets tighten, APs may reduce activity.
These constraints raise the implicit cost of arbitrage. When costs exceed expected profit, APs walk away — and the ETF/spot link loosens.
Scenarios where ETFs exacerbate price moves (practical examples)
Redemption clump + low spot depth: Large, simultaneous redemptions force custodians/APs to sell spot BTC into thin liquidity, creating outsized impact.
Market-maker withdrawal: If primary market-makers widen quotes or withdraw amid uncertainty, ETF trading becomes more volatile and discounts/premiums can persist, eroding confidence and prompting more outflows.
Index/passive reweighting shock: An MSCI rule change or rebalancing trigger could cause large, predictable flows away from (or into) funds that track benchmarks — but if many passive instruments execute simultaneously, the market impact is concentrated and acute. See CoinPaper’s coverage of MSCI change risk for a real-world framing. MSCI rule-change analysis.
Cross-asset margin calls: If correlated positions (futures, options, equities) force liquidation, ETF holders may be net sellers, compounding spot pressure.
Institutional demand, divergent behavior and the passive-flow puzzle
ETF flows are not monolithic. The same month that headline outflows occurred, some large institutions increased exposure — a reminder that investor horizons differ. The Abu Dhabi example (tripling IBIT stake) underscores that sovereign and long-only investors may view spot ETFs as cheap, scalable exposure during drawdowns, while others de-risk.
At the same time, passive flows are sensitive to index rules. MSCI changes can divert billions by altering whether funds are included in widely used indices and how they are weighted; that alters the forward-looking demand profile for ETF products. Index-driven flows are generally mechanical and can be more predictable — but a rule change that reduces index weighting for BTC-related allocations makes anticipated passive inflows less reliable, introducing reallocation risk into strategic models.
What this means for allocators and risk managers
Institutional allocators and alloc-research teams should treat spot BTC ETFs like large liquidity conduits rather than frictionless parking spots. Practical steps:
Model basis risk: stress test ETF NAV vs market-price gaps under scenarios of AP withdrawal and elevated retail volatility. Quantify potential execution costs for converting ETF shares to spot BTC and vice versa.
Factor custody and settlement timelines into liquidity buffers: assume non-zero settlement delays and higher-than-normal transaction costs during stress.
Run concentration and counterparty limits: authorized participant capacity and custodian operational constraints should factor into strategic allocation sizing.
Consider staggered exit strategies: in market-stress scenarios, block trades executed via OTC desks or worked orders with price collars can reduce market impact compared with immediate ETF redemptions.
Maintain a view on index rule risk: MSCI and similar changes can alter passive demand forecasts; incorporate policy and index governance scenarios into 3–5 year allocation models.
Bitlet.app’s suite of institutional tools and market research can be useful for teams wanting to simulate ETF-related execution scenarios and test liquidity assumptions in portfolio models.
Tactical checklist for managing ETF-related tail risk
- Establish AP and custodian contingency contacts and escalation procedures.
- Set pre-trade liquidity limits tied to realized depth in primary venues, not just AUM.
- Pre-agree OTC or block-trade pathways to unwind large positions off-exchange when necessary.
- Run weekly stress-scenarios around index reweighting events and known rebalancing windows.
- Monitor ETF flow data and NAV/market spreads intraday; treat persistent discounts as a warning sign.
Conclusion: ETFs changed the plumbing — now price formation includes the wrapper
US spot Bitcoin ETFs have broadened access to BTC for traditional investors, but that access also changes how price moves propagate. November’s crash illustrated how record ETF outflows — concentrated in vehicles like IBIT — interact with arbitrage windows, custody frictions and retail volatility to amplify market stress. Institutional demand will remain a key variable, but MSCI rule changes and divergent sovereign/institutional behaviour mean passive flows are no longer a foregone conclusion.
For crypto strategists and institutional investors, the imperative is clear: incorporate ETF mechanics into liquidity and tail-risk models, prepare for basis blowouts, and maintain execution playbooks that account for custody and AP constraints.
Sources
- Cointelegraph — Bitcoin ETF outflows and IBIT data: https://cointelegraph.com/news/bitcoin-etf-outflows-hit-record-november-as-btc-falls?utm_source=rss_feed&utm_medium=rss%3Frand%3Dxvkbj_1763722685120%26_t%3D1763722685120%26sid%3D983b062729fcec71%26cb%3Dtw3xh5&utm_campaign=rss_partner_inbound
- BeinCrypto — ETF arbitrage and retail volatility overview: https://beincrypto.com/bitcoin-etf-arbitrage-retail-volatility-us-crypto-news/
- CoinPaper — MSCI rule-change and passive-flow risk: https://coinpaper.com/12517/msci-rule-change-puts-billions-in-flows-and-michael-saylor-s-bitcoin-strategy-stock-at-risk?utm_source=snapi
- AltcoinBuzz — Abu Dhabi tripling IBIT stake: https://www.altcoinbuzz.io/cryptocurrency-news/abu-dhabi-triples-bitcoin-etf-stake-despite-losses/


