Why Bitwise’s XRP ETF Saw Blockbuster Volume While XRP Capitulated — A Data‑Driven Explainer
Summary
Setting the scene: blockbuster ETF volume vs price pain
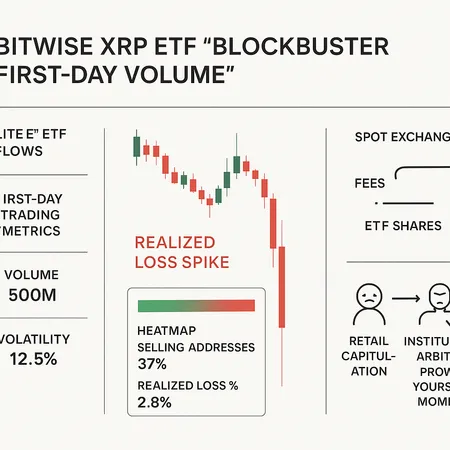
Bitwise’s newly launched XRP ETF opened with headlines: first‑day trading volumes exploded, reported at north of $100 million. That raw number captured attention and instantly became shorthand for “institutional demand.” Yet at the same time on‑chain metrics showed a sharp spike in realized losses and clear signs of selling pressure and capitulation. Those two facts sitting side‑by‑side create the central puzzle for active traders: how can an ETF launch look like a liquidity tidal wave while the underlying token is bleeding value?
For many market participants the answer starts with understanding what ETF volume actually represents and who is trading — retail flurries in secondary markets look very different from creation/redemption flows that touch spot liquidity. For context on first‑day volume, see the Bitwise coverage noting the >$100M day‑one figure here.
What the Bitwise ETF first‑day metrics tell us (and what they don’t)
A headline trading volume number bundles several activities: secondary market trades of ETF shares (investors buying and selling existing ETF units), creation and redemption activity (APs submitting baskets to mint or redeem shares), and intra‑day market‑making. High dollar volume by itself does not prove sustained net flows into the fund or immediate spot accumulation.
There are three useful buckets to parse the figure:
- Secondary turnover: retail and pros trading ETF shares among themselves; this can produce huge dollar volume without any change in the ETF’s underlying holdings.
- Creation/redemption: when authorized participants (APs) create new shares the issuer must acquire spot XRP (or receive it, depending on rules) to back the shares — that’s direct spot demand. Redemptions lead to spot outflows.
- Market‑maker hedging and delta flows: MM desks will trade both ETF shares and the underlying to manage inventory and hedge risk; those hedges can use derivatives, cash, or spot XRP depending on cost and liquidity.
The crucial takeaway: a $100M trading day could be mostly secondary turnover and hedging. It could also mask heavy creation activity — you need the breakdown between net share issuance and secondary turnover to know whether the ETF is net buying spot XRP.
Why high ETF volume can coexist with price capitulation
There are several mechanics that let ETF volumes spike while the spot price slides:
Premium/discount dynamics and AP strategy: If the ETF trades at a discount to NAV, APs may buy ETF shares on the market and redeem them for spot XRP, then sell that XRP into the market — that accelerates downward pressure. Conversely, if ETF trades at a premium, APs can buy spot and create ETF shares, supporting price. High volume alone doesn’t tell you which side is dominant.
Secondary‑market turnover vs creation flows: As noted above, heavy secondary turnover (many investors swapping ETF shares) doesn’t require new spot XRP to enter the fund. Headlines that only quote volume rarely separate these streams.
Hedging via derivatives or cash: Market makers and APs try to minimize execution costs; they may hedge ETF inventory with futures or swaps instead of repo‑style spot purchases. When derivatives are more liquid or cheaper to use, the ETF’s mechanical link to spot weakens.
Liquidity asymmetry and slippage: If on‑chain liquidity is thin, even modest redemption flows can move price sharply. The ETF can trade millions in dollars on centralized exchanges with relatively small impact on the on‑chain order books, especially if custodial and settlement frictions slow spot replenishment.
These mechanisms explain how a fanfare of ETF volume can coexist with an on‑chain realization of losses and selling pressure.
On‑chain evidence: realized loss spike and retail capitulation
On‑chain metrics give us direct insight into seller profiles. Two recent analyses highlight the same worrying pattern for XRP: a steep rise in realized loss and signs consistent with capitulation among smaller holders.
One on‑chain report showed investors realizing extreme losses — a jump consistent with retail selling into the downleg and taking losses rather than holding through the volatility (the analysis is summarized in this Bitcoinist piece). Another monitoring service flagged a key metric surging +339% while price plunged, underscoring the mismatch between network activity and price direction (see the U.Today write‑up here).
Realized loss spikes typically mean a sizable cohort sold at a loss — often smaller retail accounts or leveraged traders exiting positions. That behavior can lower immediate liquidity (because more shallow order books now house most resting bids) and raises the odds of violent intraday moves as stop‑loss cascades trigger.
Who is selling and who is buying? Retail vs institutional behavior
Profiles matter. Retail sellers tend to be reactive, debt‑sensitive, and liquidity‑seeking: they sell into a bid to exit. Institutional players — APs, hedge funds, market makers — behave differently: they are execution‑driven, liquidity‑strategic and often compensate with hedges.
When realized loss surges we usually infer a retail capitulation wave. Institutions may use that to accumulate, but they will be price‑sensitive and opportunistic: they can provide liquidity at different price tiers or step back if they see structural redemptions. The key is timing — institutions rarely buy full size into panic without a clear path to hedging and eventual exit.
To balance macro cues with microstructure, watch on‑chain indicators (realized loss, active addresses, large transfer flows), order‑book depth on major spot venues, and reported creation/redemption tallies from the ETF issuer.
Arbitrage paths between spot XRP and the ETF — practical mechanics
Arbitrage keeps ETF and spot prices aligned — but the path can be indirect in crypto. Typical routes:
AP creation arbitrage (premium scenario): AP buys spot XRP on exchanges, deposits to the custodian as a creation basket, mints ETF shares, sells ETF shares into the market. Net effect: spot buying pressure.
AP redemption arbitrage (discount scenario): AP buys ETF shares on market, redeems them for spot XRP, and sells the spot into the market. Net effect: spot selling pressure.
Synthetic hedging: APs and market makers hedge ETF exposure with XRP futures, perpetuals or swaps instead of immediate spot trades. If derivatives are more liquid or cheaper, hedges will route there first, muting direct spot impact.
Secondary market turnover: Investors swap ETF shares among each other (no spot involved). Huge turnover here does not change ETF’s underlying spot holdings.
Constraints that matter for traders: custody settlement windows, KYC/AML transfer delays for large spot transfers, venue liquidity fragmentation, and the availability/cost of arbitrage capital. These create transient dislocations where ETF and spot can decouple for hours or days.
Short‑term catalysts that could reverse or accelerate the move
Reversal catalysts:
- Net creation flows driven by sustained ETF inflows and AP spot purchases (ETF trading at a persistent premium).
- Large spot buyers (whales or institutions) accumulating from capitulation.
- Positive regulatory or macro headlines that restore confidence.
Acceleration catalysts (further pain):
- Sustained redemptions and AP redemptions into spot that add selling pressure.
- Forced liquidations from leveraged retail positions or margin calls in derivatives markets.
- Negative news specific to XRP or broader risk‑off macro events.
Monitoring short‑term direction: track the ETF’s NAV vs market price (premium/discount), daily net creation/redemption tallies released by the issuer, realized loss trends on‑chain, and order‑book depth across major spot venues.
Practical risk management for traders and PMs
For traders juggling headline ETF volume with on‑chain selling pressure, discipline matters. Practical steps:
- Position sizing: keep single‑trade exposure calibrated to the liquidity and realized volatility of XRP. Expect sharper moves when realized‑loss metrics spike.
- Use ETFs as signals, not proofs: a big ETF volume day is a data point; confirm with net creation/redemption figures and on‑chain flows before assuming spot support.
- Hedge execution risk: consider using futures or options (where available) to hedge directional exposure instead of relying solely on spot trades in thin markets.
- Watch spreads and slippage: place limit orders and avoid marketable aggressive orders into shallow books, especially during capitulation phases.
- Monitor AP and custodian announcements: large, publicized creations or redemptions are meaningful — they show actual spot transfer.
Finally, keep a checklist of watch metrics: ETF premium/discount, net shares issued, realized loss trajectory, large transfer activity on‑chain, and exchange order‑book depth.
The "prove yourself" moment — what it means for XRP going forward
Calling this a “prove yourself” moment is apt. An ETF listing creates an institutional on‑ramp, but it does not automatically erase structural fragilities: shallow spot liquidity, retail concentration, and settlement frictions still matter. If the ETF drives net sustained spot purchases through persistent creations, that’s a durable positive for price. If what we see instead is heavy secondary turnover plus periodic redemptions, headlines will remain noisy and price could remain sensitive to on‑chain capitulation.
Active traders and portfolio managers should treat the launch as a regime change — new players and instruments are in the arena — but they must reconcile headlines with hard data. Track realized loss declines (showing recovery in holder psychology), narrowing ETF discounts or persistent premiums (indicating AP spot buys), and improving order‑book depth. These combined signals will tell you whether the market is shifting from a fragile, retail‑dominated state into a deeper, institutionalized market.
For traders who integrate exchange flows with on‑chain metrics and keep execution discipline, the Bitwise XRP ETF is a new tool — and a test. Use it with measured conviction and full awareness of the arbitrage plumbing that links ETF screens to on‑chain order books.
Bitlet.app (and other execution platforms) can help monitor ETF/spot spreads and execution costs if you want automated feeds of NAV vs market moves.
Sources
- Bitwise ETF first‑day volume reporting: https://coinpaper.com/12540/xrp-enters-prove-yourself-moment-as-bitwise-etf-explodes-past-100-m-day-one-volume?utm_source=snapi
- On‑chain realized loss and capitulation analysis: https://bitcoinist.com/xrp-capitulation-investors-realizing-75-loss/
- Key on‑chain metric surge vs price plunge: https://u.today/xrps-key-metric-surges-339-but-price-plunges-hard-whats-next?utm_source=snapi
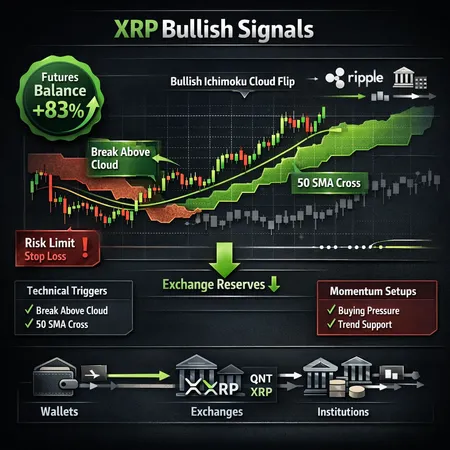
For cross‑market perspective, remember that broader market bellwethers like Bitcoin and sector coverage such as XRP will influence flow behaviour and narrative shifts.