Ethereum Under Strain: ETF Outflows, Soft On‑Chain Activity, and the BitMine Risk
Summary
Executive snapshot
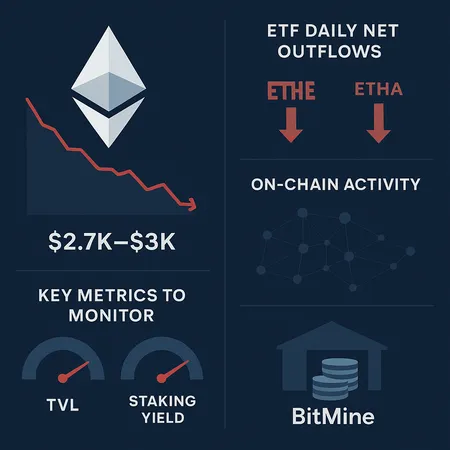
Late‑2025 sent several diagnostic lights flashing for Ethereum allocators: ETF products experienced daily net outflows of hundreds of millions, ETH briefly tested the $2.7k–$3k range, on‑chain usage remained muted, and large corporate accumulators such as BitMine introduced concentration risks that complicate liquidity and valuation dynamics. For portfolio managers and ETH allocators this is not just market noise — it’s a cross‑section of flow, usage, and balance‑sheet signals that should influence position sizing and monitoring.
ETF outflows: a driver of short‑term price pressure
ETF vehicles tied to ETH — notably products trading under tickers like ETHA and ETHE — became net sellers in the most recent sessions. Reporting showed daily net outflows of about $261.59M, with ETH‑linked ETFs leading losses and forcing a rethink about institutional demand elasticity Blockonomi reported this update. ETF flows have become a near‑real‑time gauge of institutional appetite; when they turn negative at scale they can amplify price moves simply by increasing the sell pressure available to markets.
A large, consistent outflow cadence matters because ETF redemptions (or secondary market selling by ETF holders) can interact with other liquidity drains — exchange outflows, miner or staking liquidations, or corporate sellers — to push prices into stress bands. That dynamic is especially relevant when ETFs are major marginal buyers in calmer regimes and stop buying precisely as retail or on‑chain demand softens.
Price action and short‑term catalysts
ETH dropping into the low $3k range and testing $2.7k was both a symptom and a cause of stress. Short‑term market events and tactical moves — such as the SharpLinks trade discussed in recent coverage — pressed on the market and accelerated momentum selling around the $3k mark AmbCrypto covered the short‑term market pressure. Traders should treat price levels like $2.7k–$3k as psychological and liquidity thresholds: once breached, stop‑loss cascades and margin calls can increase realized volatility.
Why weak on‑chain activity is worrying for valuation
Price is one side of the story; usage is the other. Several analysts warned that the deeper problem for ETH was muted on‑chain activity, not merely the fiat price. Coverage documenting the crash to roughly $2,700 highlighted 10x Research's concern that fragile on‑chain metrics are the real issue for sustained valuation Coinpedia reported that warning.
Why does on‑chain activity matter?
- Transaction counts and active addresses are leading indicators of demand for blockspace. Lower usage reduces fee revenue and weakens the utility narrative.
- TVL (total value locked) in DeFi contracts correlates with staking incentives and on‑chain yield dynamics; falling TVL reduces protocol revenue and economic activity.
- Lower activity can make staking yields relatively less attractive vs. liquid alternatives, tightening the pool of long‑term holders.
In short, price declines driven by flows are amplified if they occur simultaneously with declining fundamentals on‑chain. That combination degrades both speculative narratives and the real economic incentive to hold ETH for protocol usage.
BitMine and the corporate concentration dilemma
Corporate accumulation strategies now play a bigger role in market microstructure. The BitMine case offers a useful case study: as corporate buyers accumulate ETH on their balance sheets, they create both a floor and a source of systemic risk. Cryptoslate's analysis framed this as a digital‑asset dilemma — meaningful balance‑sheet exposure to ETH helps firms earn upside but increases concentration risk and the potential for liquidity crunches if prices turn Cryptoslate on BitMine.
Key concerns with corporate accumulation:
- Concentration: A few large holders can control substantial portions of liquid supply, making the market more fragile in stressed conditions.
- Liquidity mismatch: Corporate balance sheets are often marked to market but may be used for operational leverage or to collateralize debt; rapid mark‑to‑market losses can trigger sales.
- Signaling and herding: Large sellers can induce other market participants (ETFs, funds) to reduce exposure, creating a feedback loop.
BitMine’s accumulation narrative illustrates how corporate behavior can shift from being a stabilizer (long‑term buyer) to an accelerant of downside when balance‑sheet considerations change.
Staking, yield and the network economics feedback loop
Staking is central to Ethereum’s economic model post‑merge. When on‑chain activity and TVL soften, two connected effects emerge:
- Yield compression or re‑pricing of staking demand. If fees are lower because fewer apps and users transact, the composite return from staking (fees + issuance) falls, reducing the attractiveness of staking relative to liquid yield alternatives.
- Changes in lockup dynamics. Lower expected returns can increase the incentive to withdraw (or to prefer liquid staking derivatives), raising short‑term sell pressure.
Additionally, staking concentration amplifies fragility: when a few entities (including corporate accumulators) control large staked positions, any change in their liquidity needs affects supply in spot and derivatives markets. That interaction connects ETF flows, corporate balance sheets, and staking economics into a single risk matrix.
Diagnostic framework for portfolio managers (what to watch weekly)
For allocators looking to move from intuition to a repeatable monitoring routine, here are practical metrics and thresholds to track:
- ETF flows: daily and 7‑day net flows for ETHE/ETHA and other ETFs. Persistent net outflows (>100M/day for several sessions) should raise allocation review flags.
- Exchange flows: net inflows to centralized exchanges (sellers) vs outflows to cold storage (longer‑term holders).
- Active addresses and transaction counts: a rolling 30‑day view to spot secular declines in usage.
- TVL across major DeFi categories: lending, DEXes, and liquid staking protocols. Meaningful drops (>10% week‑over‑week) can presage fee declines.
- Staking metrics: total ETH staked, concentration by top validators/addresses, and withdrawals (on a net basis).
- Funding rates and derivatives open interest: persistent negative funding or declining OI suggests deleveraging.
- Large holder flows: movement of large blocks (e.g., corporate wallets) to exchanges — an early warning for potential sales.
Tie these metrics to rules: for instance, reduce exposure by X% if ETFs record 7‑day cumulative outflows >Y and active addresses fall by Z% concurrently.
Scenarios for stabilization and timing expectations
Scenario A — Stabilization and recovery (base case, 40% probability)
- ETF flows stabilize (inflows or neutral), on‑chain activity stops declining, and TVL bottoms.
- Result: fee income stabilizes, staking yields recover slightly, and ETH trades back above $3.5k as narratives improve.
Scenario B — Prolonged weak demand (bear, 35% probability)
- ETF outflows persist, on‑chain usage remains muted, and corporate holders show signs of rebalancing.
- Result: prolonged price pressure, staking yields compress, and derivative markets price in higher tail risk — allocation should be defensive.
Scenario C — Idiosyncratic shock (tail risk, 25% probability)
- A large corporate or fund liquidates a concentrated position into thin liquidity windows (or regulatory news forces reallocations).
- Result: sudden liquidity drain, flash price dislocations below recent lows, and margin cascade across derivatives markets.
Each scenario implies different tactical responses: defensive trimming and hedging in Scenario B, close monitoring of corporate wallets and exchange flows in Scenario C, and opportunistic re‑entry in Scenario A once metrics confirm stabilization.
Practical next steps for ETH allocators
- Build a daily dashboard: ETF flows (ETHE/ETHA), exchange inflows/outflows, active addresses, TVL, staking totals and large‑wallet movements.
- Use thresholds rather than point estimates: look for sustained changes over 3–7 days.
- Consider liquidity reserves or hedges (options collars, inverse futures) sized to ETF‑flow risk.
- Revisit concentration exposure: if corporate accumulation is a material part of the market, factor potential forced sellers into stress tests.
For teams using execution or custody platforms, integrate alerts for large wallet moves and sudden changes in ETF flows; many allocators now consolidate these signals into a single risk dashboard. (Platforms such as Bitlet.app provide institutional tooling that can be part of that pipeline.)
Conclusion
Ethereum’s late‑2025 stress episode is instructive because it combined flow (ETF outflows), valuation pressure (price into $2.7k–$3k), fundamentals (soft on‑chain activity) and concentration (corporate accumulation). That mix raises the cost of complacency for ETH allocators: it’s not enough to watch price alone. A disciplined monitoring framework — focused on ETF and exchange flows, active addresses, TVL, and staking concentration — will help distinguish a tactical drawdown from a structural deterioration.
If on‑chain activity recovers or ETF flows normalize, valuations should follow. If they do not, concentration risks (e.g., large corporate holders) and the mechanics of staking and liquidity could extend the drawdown. Traders and allocators who tie allocation decisions to these observable metrics will be better positioned to defend portfolios and identify the next entry points.
Sources
- Ethereum ETFs update: daily net outflow hits $261.59M as ETHA leads losses — Blockonomi
- Ethereum crashes to $2,700 — 10x Research warns the real problem is on‑chain — Coinpedia
- BitMine and the digital asset dilemma as Ethereum losses mount — CryptoSlate
- SharpLinks move puts pressure on Ethereum as it drops below $3k — AMBCrypto
For broader market context, remember that Bitcoin and major DeFi TVL trends often lead narrative shifts that influence ETH demand.