Anatomy of the Nov 14 BTC Flash Move: Liquidations, Leverage and the Fed Link
Summary
What happened on November 14: a concise timeline
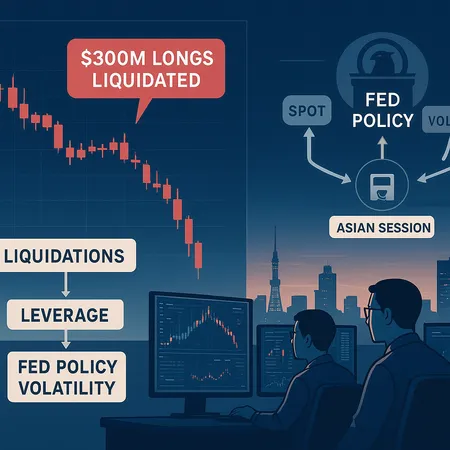
On Nov 14 BTC breached the psychological $100,000 mark and the market immediately reported roughly $300 million of long liquidations across major venues. The catalyst was a string of hawkish comments from Fed officials that re-anchored market expectations for higher-for-longer rates. The immediate market response was a classic cross-venue cascade: derivatives losses triggered forced selling, liquidity evaporated in the Asian session, spreads widened, and the price dropped further — feeding more liquidations.
This piece unpacks that cascade step-by-step. If you trade or manage crypto risk, the aim is operational: understand how the shock propagated, where concentration risks live, what technical levels matter in the short and medium term, and which risk-management playbooks actually work in these episodes.
Anatomy of a liquidation cascade
Trigger mechanics: margin calls, auto-liquidations, and market orders
Most liquidation cascades follow the same plumbing. A price move — often initiated by macro news or a large spot sale — pushes mark prices against leveraged long positions. Exchange risk engines issue margin calls; if margin is insufficient, exchanges convert maintenance margin shortfall into forced market orders. These forced sell orders hit the order book as market demand, which in thin markets eats through bids and creates a sharp price decline.
Two practical points:
- Market orders from forced liquidations are not discretionary selling; they are algorithmically executed to meet margin requirements and therefore concentrate selling pressure in a short interval.
- Exchanges differ in liquidation processes (cross-margining, isolated margin, partial fills, and whether they use insurance funds or ADL — auto-deleveraging). These differences matter during stress.
How liquidations amplify price moves
Liquidations become self-reinforcing because the very action of liquidating creates the adverse price movement that triggers the next tranche of liquidations. Typical amplifiers include:
- High open interest concentrated at key strikes or price levels (clusters of long levered positions).
- Thin spot liquidity in off-peak sessions (especially the Asian session).
- Market makers widening quotes or pulling liquidity to avoid inventory risk.
- Funding-rate feedback in perpetual swaps: extreme negative funding (longs paying shorts) can accelerate deleveraging.
When $300M of longs evaporated on Nov 14, that was not a flat $300M of coordinated selling — it was an accumulation of many small forced sales, margin calls, and stop runs that interacted with already thin liquidity.
Leverage concentrations and market microstructure
Where leverage concentrates and why it matters
Leverage in crypto is mostly concentrated in perpetual swap markets and on a small set of exchanges where retail and prop traders take outsized positions using easy access to credit. Key concentration points to monitor:
- Open interest (OI) by exchange — look for >20–30% of total OI centralized on one venue.
- Large positions in funding-unaware algorithms and copy-trading pools.
- Options hedges that are delta-heavy and get recalibrated en masse.
Concentrated OI means that price moves have an outsized impact on margin requirements at those venues, making them the epicenters of a liquidation spiral.
Exchange mechanics: ADL, insurance funds, and margin engines
Different exchanges handle stress differently. Two mechanisms are crucial:
- Insurance funds: absorb losses when liquidations exceed counterparty margin; deep funds slow ADL but can be depleted.
- Auto-Deleveraging (ADL): when an insurance fund is insufficient, profitable traders can be forced to take the opposite side, often at unfavourable prices.
Operationally, funds and traders should know exchange-specific rules and model tail-cost scenarios (e.g., how much slippage to expect when a $50M forced sell hits a particular exchange order book). No two exchanges behave identically under duress.
Spot vs. derivatives interplay: how both feed the cascade
Basis, basis trades and when they break
Basis trades (long spot, short futures/perpetual) rely on stable funding and predictable hedging costs. When the market re-prices risk rapidly — as with hawkish Fed talk — basis can widen or flip, forcing basis-traders to adjust hedges quickly. If many participants rebalance at the same time, hedging flow hits spot and derivatives simultaneously, increasing volatility in both.
A compressed example: a sudden drop in BTC price pushes short-term funding negative; perpetual holders selling to exit longs hit spot, widening the basis further and forcing more re-pricing.
Market makers, delta-hedging and inventory effects
Market makers hedge options and futures dynamically. When gamma exposure is high and the market moves, dealers need to hedge by buying or selling spot aggressively — a process that can amplify moves if liquidity is thin. The result is a two-way feedback loop: derivatives hedging pushing spot, and spot moves changing derivatives marks.
Why the Asian session amplified the move
The Asian trading session routinely amplifies volatility for several operational reasons:
- Thin spot liquidity: Asian hours often have thinner global liquidity, especially at levels where most market makers reduce exposure overnight.
- Time-zone participants: Large regional flows (OTC dealers, Asian exchanges) can introduce concentrated selling that isn't immediately offset by US or European buyers.
- Latency in information absorption: Fed commentary often arrives during or after other sessions, and the mosaic of local read-throughs (FX, equities, regional bond flows) can push crypto in a particular direction.
In short: a derivatives-driven price shock that occurs or persists into the Asian session will be met with lower immediate liquidity and fewer passive buyers, increasing the slope of the descent and the size of liquidation-induced market orders.
Macro link: Fed messaging, rate expectations and risk-off
Hawkish Fed comments change the macro backdrop in ways that reduce risk appetite across asset classes. Mechanically:
- Higher rate expectations increase discount rates, lowering the present value of long-duration risk assets like crypto.
- Rising nominal yields often tighten liquidity conditions as funding costs climb (both in fiat and in crypto derivatives funding rates).
- Rate uncertainty can spur cross-asset de-risking: flows out of equities and into cash/short-duration bonds can coincide with long unwind in crypto.
On Nov 14, Fed messaging shifted expected terminal rates or the path of hikes slightly higher, and that was enough to trigger stop-losses and margin-stress among levered players. The macro trigger doesn’t have to be large; in high-leverage markets, small changes in expectations can have outsized mechanical impacts.
Expected technical levels: short- and medium-term scenarios
Any technical road map must be framed as scenarios rather than hard predictions. Here are reasoned anchoring points based on common structural levels and behavior after a liquidation shock:
Short-term (hours to days):
- Immediate resistance: $100,000–$105,000 — reclaiming this band will require liquidity providers to re-enter and for funding/incentives to normalize.
- Immediate support: $92,000–$96,000 — this band is typically where larger resting bids reappear and where short-term liquidity providers show depth.
Medium-term (weeks to months):
- Bear case: if the derivatives basis stays dislocated and macro conditions remain hawkish, a retest of $80,000–$85,000 is plausible as forced deleveraging continues and leverage rebuilds slowly.
- Bull case: if Fed-speak dovetails and risk appetite returns, a recovery through $110,000–$120,000 is possible as funding normalizes and spot buyers reassert.
Guiding principle: map technical levels to liquidity depth (order-book heatmaps and historic VWAP bands) rather than round numbers alone. A 3–6% flash move back above $100k does not equal regime change; look for persistent OI contraction, funding normalization, and restored bid-side liquidity.
Risk-management playbook — practical, operational rules
Below are tactical rules and operational protocols for traders and funds to survive high-leverage pulses.
For active traders:
- Limit gross leverage: cap instantaneous leverage and require incremental margin buffers during high implied volatility.
- Use staggered exposure: build or reduce positions in tranches to avoid being fully liquidated by a single gap.
- Prioritize liquid exits: prefer exchanges with known, deep order books and clear liquidation rules for large positions.
- Options as targeted hedges: use puts or collar structures to cap tail losses rather than relying solely on stop-loss market orders in thin sessions.
For funds and risk officers:
- Predefine circuit breakers: set both percentage and notional-based triggers for manual intervention.
- Stress-test across venues and sessions: simulate forced liquidations during the Asian session, with realistic slippage and funding shocks.
- Diversify execution: split large exits across venues and OTC to reduce market impact.
- Maintain liquidity buffers: hold cash or stable collateral to meet margin calls without fire-selling.
- Monitor cross-asset signals: funding rates, open interest, options skew, US yield movements, and Asian FX flows should be real-time watchlist items.
Operational checklist (pre-event):
- Know exchange ADL rules and insurance fund levels.
- Maintain a rolling map of where >10% of your OI is parked.
- Test margin-call procedures and counterparty contacts quarterly.
- Automate position-reduction logic, but keep manual overrides for nuanced decisions.
Post-mortem metrics and a watchlist
After a flash move, teams should reconvene with a focused post-mortem. Key metrics to analyze:
- Realized slippage vs expected slippage for market exits.
- Sequence and timing of liquidations by exchange and instrument.
- Funding-rate shock and how it affected P&L and basis positions.
- Order-book depth during the event across sessions (UTC-lagged snapshots).
Watchlist items for the coming weeks: open interest concentration, funding-rate normalization, option skew compression, and any further Fed communications. Also track regional flows during Asian session windows — that’s where similar pulses can originate or intensify.
Final takeaways
The Nov 14 flash move was not simply a price print below $100k — it was a system event driven by concentrated leverage, exchange mechanics, and a macro nudge from hawkish Fed commentary that found an unfortunate match in the Asian session’s liquidity profile. For traders and risk officers, the lesson is operational: measure and limit leverage, plan for session-specific liquidity risk, and build robust, tested playbooks to respond to rapid deleveraging.
Monitor the core indicators (open interest, funding, option skew, order-book depth), rehearse your liquidation and hedging protocols, and keep a liquidity buffer. If you need execution or risk tooling that factors in cross-venue liquidation impact and real-time funding analytics, integrate platform data feeds — for example, tools provided by venues and services like Bitlet.app can help centralize monitoring — and run regular stress tests.
Keep the checklist close, and treat every high-leverage pulse as both a trading opportunity and a systems stress test: survive first, optimize later.
Bitcoin and Volatility will remain the core lenses for this story as markets digest the Fed’s next moves and liquidity cycles reset.