Dissecting Conflicting Bitcoin ETF Flows at Year-End 2025 — What It Means for 2026 and the Four‑Year Cycle
Summary
Executive snapshot
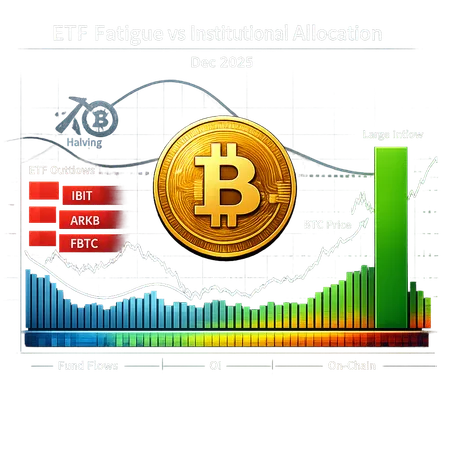
Late December 2025 delivered a jarring set of headlines: on December 31 a large, headline‑grabbing $348M outflow closed the year with net ETF exits, with IBIT and ARKB prominent among the withdrawals, while days later U.S. spot Bitcoin ETFs registered a $355M inflow that broke a seven‑session outflow streak. These two facts live side‑by‑side in the market's memory and produce contradictory narratives about ETF fatigue versus renewed institutional allocation.
This article untangles those signals, weighs the arguments that claim the four‑year halving cycle is over against the bulls who still expect a 2026 all‑time high, and gives a practical set of indicators traders should watch to move from opinion to evidence-based positioning.
What actually happened at year‑end — the numbers and context
On December 31, Blockonomi reported a $348M outflow that closed the calendar with net exits, noting that IBIT and ARKB dominated the exits that day. That headline made many traders and newsfeeds declare a ‘sell the rally’ mood at year's end. But the flows picture changed quickly: a few sessions later US spot Bitcoin ETFs registered a $355M inflow that ended a seven‑session streak of outflows, according to Crypto‑Economy. Taken together, the sequence looks like a short, acute withdrawal followed by a significant re‑entry.
These are the kinds of daily and multi‑day swings that can create the impression of a decisive shift while in fact reflecting mechanical behaviors — creation/redemption timing, tax‑calendar effects, window dressing, and rebalancing from large allocators — rather than a simple binary of institutional bullishness vs. capitulation.
ETF fatigue vs. real institutional allocation: two competing narratives
One camp argues ETF flows show genuine ETF fatigue: investors may be lukewarm toward the marginal utility of additional ETF allocations, daily flows are compressing, and headlines about outflows reinforce a cautionary tone. CryptoSlate summarized this fatigue dynamic, warning that daily inflows and outflows can mislead if treated as equivalent to structural allocation changes.
The opposing view says a single or even a few outflow days don’t negate the broader trend of institutions using ETFs to access BTC. Proponents of this view point to the $355M inflow that broke the outflow streak and to analyst expectations that ETF allocation will accelerate after large allocators finalize allocations and benchmarks. A bullish piece collected expert views suggesting Bitcoin could reach a new all‑time high in 2026 as ETF penetration deepens.
Both views contain truth: short‑term ETF swings are noisy, but repeated, sustained inflows over weeks and months — accompanied by clear changes across futures and on‑chain metrics — are meaningful evidence of institutional allocation.
Is the four‑year cycle still alive? The theoretical conflict
The four‑year cycle — historically driven by the halving’s supply shock combined with time‑delayed demand responses — has underpinned many traders’ mental models. Cointelegraph recently questioned whether that pattern remains robust in an era dominated by spot ETFs and concentrated liquidity. Their argument: ETFs change the distribution channel and timing of demand, potentially smoothing or shifting the old cadence.
Counterarguments note that the fundamental supply constraint from the halving remains unchanged; what can change is the market’s reaction function. ETFs can front‑load demand (large blocks bought on behalf of institutions) or act as a slow, steady buyer. In either case, the halving still reduces miner sell pressure on a deterministic schedule — the long‑term scarcity effect persists, though its market timing may be altered.
In short: the halving as a mechanical event is not dead, but the observable price pattern that traders call the four‑year cycle may be evolving rather than extinguished.
How to read ETF flows properly — what traders often miss
Flows are headline‑friendly but high‑noise. A multi‑session inflow is more informative than a single day, but context matters: look at the size relative to total ETF AUM and the creation/redemption details (are inflows paper‑based or backed by actual spot deliveries?).
Not all flows equal institutional demand. Some ETF flows come from retail wrappers, programmatic rebalancing, or even arbitrage activity between spot and derivatives.
Pay attention to which tickers lead. On Dec 31, IBIT and ARKB were notable among the exits; tracking which products lead inflows or outflows helps identify the type of investor (active, quant, or institutional mandate) driving flow.
ETF flows should be combined with derivatives and on‑chain signals for a fuller picture.
A practical indicators checklist: what to watch into 2026
Below are the indicators that, together, help distinguish ETF noise from sustained institutional allocation:
Aggregated ETF net flows (daily, weekly, rolling 30‑day): look for a persistent positive trend rather than isolated spikes. Pay attention to whether inflows are broad‑based across tickers (e.g., IBIT, FBTC, ARKB) or concentrated.
Futures open interest (OI) and basis (spot‑futures spread): rising OI with tightening basis suggests fresh leveraged interest; if OI rises while ETF inflows are positive and funding rates stay positive, that’s a bullish confluence.
Perpetual funding rates and basis trades: consistently positive funding indicates demand for longs, but short squeezes can distort the signal.
Exchange spot balances and large withdrawals: declining exchange reserves, especially driven by large transfers to cold storage or institutional custodians, support the accumulation story. If ETFs are taking custody off‑exchange, balances will fall.
On‑chain accumulation metrics: increase in the number of non‑zero addresses, supply held by long‑term holders, and changes in realized market cap indicate structural accumulation. On‑chain accumulation that persists during neutral or slightly negative price environments is the most convincing signal of conviction buying.
Creation/redemption mechanics and ETF NAV premium/discount: recurring positive premiums and increased primary market creations imply spot buying rather than mere paper flow.
Concentration of flows and whale behavior: if a few entities (or a handful of custodial wallets) account for most of the inflow, monitor concentration risk.
Macro correlations: risk‑on equity flows, interest rate expectations, and dollar strength can mediate Bitcoin’s response to ETF activity.
Scenario frameworks: how to trade the competing outcomes
Bull case (validated allocation): sustained weekly ETF inflows, falling exchange balances, rising on‑chain accumulation, steady or rising OI with neutral/positive funding. Action: position for trend continuation; consider layering long exposure with size scaling tied to continued flows.
Neutral / range case (ETF fatigue or choppy allocation): alternating inflow/outflow sessions, flat OI, funding oscillating around zero, on‑chain accumulation stagnating. Action: favor range strategies, options structures, and defensive position sizing; use clear stop rules.
Bear case (distribution or exit): persistent net outflows, rising exchange balances, rising OI with negative funding (shorts crowd), and declining on‑chain long‑term holder metrics. Action: reduce spot exposure, hedge with inverse products, or tighten risk controls.
Practical watchlist and thresholds (discipline, not prophecy)
Watch aggregated ETF flows: a persistent weekly inflow representing >0.5–1% of combined ETF AUM is noteworthy; smaller daily headlines rarely alter the macro trend.
Monitor exchange balances: multi‑week declines totaling several thousand BTC are stronger evidence of real accumulation than single‑day moves.
Funding rates + OI: funding persistently >0.03% per day with rising OI suggests leveraged bullishness; conversely, negative funding with rising OI is a risk sign.
On‑chain accumulation: rising supply in addresses classified as long‑term (>1 year holding) and an increasing number of new long‑term holders matters more than short‑term distribution spikes.
These thresholds are guideposts — treat them as part of a checklist, not a trading algorithm on their own.
Where headlines mislead: a final caveat
Daily flows and sensational outflow/inflow headlines attract attention but can be produced by mechanical processes: fiscal year‑end selling, arbitrage desks, or primary market creations tied to a single large investor. CryptoSlate’s coverage of ETF fatigue reinforces that traders should avoid conferring too much predictive power on single‑day prints. In other words: flows are a signal, but you need the full constellation — derivatives, on‑chain, custody behavior — to interpret it.
Final takeaways for 2026 and the cycle question
The halving remains a structural, deterministic supply event; whether that produces the same four‑year price signature depends on how and when demand manifests through ETFs and other channels.
Is the four‑year cycle dead? Not yet. It's more accurate to say the cycle is evolving in a market with ETFs and deeper institutional plumbing.
ETF flows at year‑end 2025 were contradictory in the headlines, but when combined with futures OI and on‑chain accumulation, traders can separate noise from genuine allocation.
For macro traders: prioritize persistent trends across multiple indicators. Use ETF flows as an early warning or confirmation tool — not as the sole basis for conviction.
Keep a watchlist (aggregated flows, OI & basis, funding, exchange balances, and on‑chain accumulation) and update thresholds to reflect changing market structure. Platforms and dashboards — including tools like Bitlet.app for portfolio and flow monitoring — can help centralize these signals without replacing careful analysis.
Sources
- Spot Bitcoin ETFs break outflow streak with $355M inflow amid liquidity boost — Crypto‑Economy
- Bitcoin ETFs close the year with $348M outflow; IBIT and ARKB dominate exits — Blockonomi
- Is Bitcoin four‑year cycle dead? — Cointelegraph
- Bitcoin ETF fatigue is real — these are the 10 days that mattered in 2025 — CryptoSlate
- Will Bitcoin reach a new ATH in 2026? Expert views — Crypto‑Economy
For more on the mechanics of ETF flows and custody, see coverage of specific tickers such as IBIT, ARKB, FBTC and broader discussions around Bitcoin and how institutional channels shape price discovery.