Bitcoin's Failed $90K Breakout: Market Structure, OI Dynamics, and Q1 2026 Playbook
Summary
Executive overview
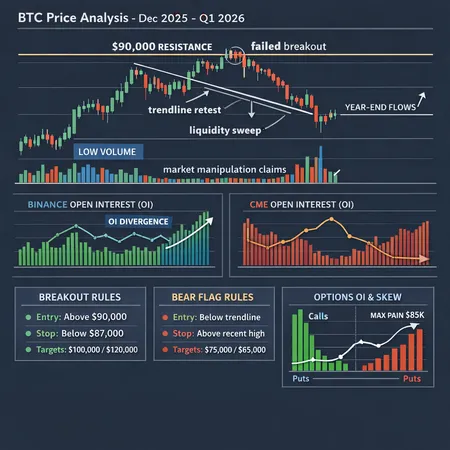
Bitcoin’s late‑December 2025 push toward $90k stalled at a visible resistance zone and quickly retraced into a retest of the ascending trendline. The move happened in low year‑end volumes, with concentrated futures open interest and clustered options expiries magnifying the short‑term price impact. This explainer breaks down the price action, the role of futures and options flows (Binance vs CME), allegations of market manipulation, and, most importantly, practical trade frameworks and risk rules for Q1 2026 traders.
What happened: the failed $90k breakout
Price action and the resistance wall
The breakout attempt lacked the follow‑through typical of sustainable breakouts. BTC rallied into the mid‑$80ks and ran into a confluence of overhead resistance: the psychological $90k level, a multi‑month horizontal supply band, and short‑to‑medium term moving averages. CryptoPotato documented how BTC stopped at this key resistance during the recent move, and chart studies from CryptoDaily highlight the failed $90k breakout and subsequent retest of important trendlines. Those are textbook signs that buying pressure exhausted at the same place sellers congregated.
Volume, year‑end flows and momentum
Two mechanics mattered more than price alone: low spot volume and timing. Year‑end liquidity tends to dwindle as institutional desks reduce risk, reallocate P&L, and close books. Thin volumes amplify the market impact of concentrated flow — option hedging, large futures liquidations, or a handful of aggressive market makers can tilt price rapidly. The FXEmpire forecast noted the importance of Q1 2026 flows in determining whether BTC can re‑accumulate enough momentum to push above $100k or instead consolidate lower. In short: low-volume breakouts are fragile.
Market structure: trendline retest, open interest, and options dynamics
Trendline retest: what to watch
After the failed breakout, price pulled back to retest the ascending trendline that had supported the recent rally. A clean retest is one where price (a) tests the trendline on lower volume, (b) forms a constructive technical pattern (e.g., hammer or bullish divergence on RSI), and (c) bounces with renewed participation. A breakdown beneath the trendline on rising volume is a structural red flag that upgrades the setup from a corrective dip to the early stage of a bear flag.
Key observation: don’t trade the retest in isolation — corroborate with OI and volume signals below.
Futures open interest: Binance vs CME dynamics
Futures open interest (OI) reveals where large leverage sits and which venues carry concentrated risk. Recent reporting showed Binance overtaking CME in Bitcoin futures open interest amid institutional selloffs; Coingape details how Binance’s OI growth shifted parts of leverage off regulated venues onto the exchange‑centric order flow pool. When Binance carries outsized OI, then retail and Asia‑based directional bets can create more violent short squeezes and liquidations because margin rules and cross‑margin mechanics differ versus CME.
Practical takeaway: watch not just total OI but the place of OI. A rising OI on Binance against falling CME OI is a signal that leveraged retail or leveraged trading desks may be the marginal liquidity providers — that matters for the size and speed of next moves.
Options expiries, gamma, and directional flows
Options structure around key strikes (like $90k) was crowded during late December. OI concentration near round numbers creates gamma pinning pressure where market makers hedge delta dynamically, potentially anchoring spot near expiry. FXEmpire and options flow trackers noted large expiries that can flip hedging from short to long gamma or vice versa, amplifying intraday moves.
Options considerations:
- When dealers are short gamma, they hedge by selling into rallies and buying into dips, which dampens moves and encourages chop.
- When dealers are long gamma, they buy into rallies and sell into dips, increasing momentum.
A change in net gamma (tracked through aggregate OI and open put/call skew) around month‑end or quarter‑end expiries can explain abrupt shifts in price behavior.
Claims of market manipulation: what to make of them
Investigative work by CryptoSlate alleged engineered short‑term moves and even caught a market maker on on‑chain evidence. Allegations like these are important because concentrated, intentional flow can produce outsized short windows of illiquidity. However, manipulation claims should be treated as an elevated risk factor, not a sole trading rationale. Market structure still follows supply/demand: manipulation can accelerate moves and create unpredictability, but it rarely changes the broader technical picture unless it alters participant positioning materially.
Q1 2026 scenarios: plausible paths and trigger levels
We’ll frame two primary scenarios and the critical signals that would validate each.
1) Bull breakout scenario — clean reclaim and continuation
Thesis: BTC re‑accumulates above $90k with volume and OI support and clears the next supply zone toward $100k+.
Validation triggers:
- Spot closes decisively above $90k on 24‑hour volume above the recent 21‑dma.
- Futures OI increases in concert across both Binance and CME (meaning institutions aren’t fully selling into the move).
- Options skew neutralizes (put OI declines or call OI rises), and dealers move from net short gamma to net hosted long gamma around strikes above $90k.
Targets and timeline:
- Near target: $100k psychological and then the prior all‑time high cluster.
- Momentum target: measured move equal to the height of the formation that led to the breakout (use your chart to compute).
Invalidation: daily close back under $85k or a breakdown under the ascending trendline with rising volume.
2) Bear‑flag / extended retest scenario — consolidation lower
Thesis: Breakout failure evolves into a bear flag, with BTC retesting $70–80k, driven by liquidation cascades, declining CME OI, and dealers short gamma.
Validation triggers:
- Breakdown below the ascending trendline on above‑average volume.
- Diverging OI: Binance OI remains elevated while CME OI falls, implying retail leverage is the marginal flow and risk of forced deleveraging increases.
- Options skew steepens put‑heavy near lower strikes and implied vols rise — symptomatic of growing downside protection buying.
Targets and timeline:
- Support zone to watch: $75–80k (previous consolidation low and liquidity pocket).
- Extended bear flag can revisit $70k in a deeper correction if macro risk aversion spikes.
Invalidation: strong reclaim of $90k with institutional OI buildup at CME and normalized volumes.
Actionable trade frameworks and rules
Below are concrete playbooks for both breakout and bear‑flag outcomes, focused on entry rules, stops, sizing, and options adjuncts.
If you trade the breakout (directional, spot or futures)
Entry:
- Aggressive: enter on a 4‑hour close above $90k with volume > 21‑dma.
- Conservative: wait for a daily close above $90k and a follow‑through day that holds above that level.
Stops and targets:
- Stop: initial protective stop under the breakout candle low or under the trendline — typically 3–6% depending on timeframe.
- Targets: scale partial profits at $100k, remainder at measured move target.
Risk rules:
- Max size: risk 1–2% of capital on the initial leg; scale in with confirmation rather than all‑in at breakout.
- Watch OI: trim if Binance OI explodes while CME OI falls — that’s a sign of retail leverage crowding the move.
Options adjuncts:
- Buy a call spread (e.g., 1–2 month 90/110k) to limit cost and avoid infinite delta risk.
- Alternatively, sell put spreads below the trendline (e.g., 65/75k) to monetize belief in a continued uptrend, but size conservatively in case of forced deleveraging.
If you trade the bear flag (shorts or protective hedges)
Entry:
- Aggressive: short on a break and daily close beneath the ascending trendline with rising volume.
- Conservative: wait for a backtest to the broken trendline that fails to reclaim it (a classic retest short set‑up).
Stops and targets:
- Stop: above the broken retest high or recent local resistance.
- Targets: step down into $75–80k and $70k liquidity bands; scale into winners with reduced size near each target.
Risk rules:
- Use tight risk per trade (1% of capital). Shorts into dramatic squeezes can be painful; keep margin light.
Options adjuncts:
- Buy put spreads (e.g., 90/70k) to express downside with defined risk.
- For cheaper hedges, purchase out‑of‑the‑money puts or put calendars that gain if implied vol rises on downside moves.
Position sizing, skew monitoring and OI cues
- Reduce directional size when implied volatility collapses and OI concentrates on one side (sign of crowded trade).
- Pay attention to skew and vols: a sharp rise in put IV is a warning sign for downside.
- Spike in Binance OI without CME support often precedes violent intraday ruptures; reduce leverage or favor defined‑risk option positions.
Execution checklist and real‑time monitoring
- Volume confirmation: 24‑hr volume relative to 21‑dma.
- OI breadth: compare Binance vs CME OI flows (divergence is a red flag).
- Options flow: heavy single‑strike OI at $90k or clusters around expiry — expect pinning or abrupt derisking.
- On‑chain flags: unusual large OTC transfers or concentrated exchange inflows can precede selloffs.
- News/manipulation signals: treat allegations as an extra volatility risk; widen stops and prefer defined‑risk structures when headlines circulate.
For platform traders, tools that show venue‑split OI and options gamma surface are crucial — Bitlet.app and other analytics suites can help visualize these cross‑venue risks in real time.
Final thoughts
A failed $90k breakout in thin markets is not a death sentence for the bull case, but it is a timely reminder that market structure — where liquidity sits, how options are positioned, and which venues hold leverage — matters just as much as price levels. For Q1 2026, frame your thesis around clear triggers, monitor cross‑venue OI (Binance vs CME), and favor defined‑risk options plays when uncertainty or manipulation claims rise. Whether you favor the breakout path or expect an extended bear‑flag, discipline in entries, rigid stops, and real‑time OI/volume monitoring will separate sound trades from speculation.
Sources
- CryptoPotato — Market Watch: Déjà Vu — BTC stopped at key resistance; Canton CC surges again
- CryptoDaily — Bitcoin BTC chart breakdown: failed $90k breakout, retest of key trendlines
- FXEmpire — Will Bitcoin price rise or fall in Q1 2026? Forecast analysis
- CryptoSlate — Bitcoin’s violent crash cries: multi‑billion dollar manipulation claims and on‑chain evidence
- Coingape — Binance tops CME in Bitcoin futures open interest amid institutional selloffs
For related strategy reads, consider tracking educational pieces under Bitcoin and developer resources on options and futures.