Why $1B+ in XRP ETF Inflows Hasn't Pushed the Price Past $2
Summary
The puzzle: big ETF flows, small price reaction
In late-cycle markets you learn to treat large headline flows as necessary but not sufficient for price breakouts. Recent reporting that over $1 billion flowed into XRP ETFs — even as XRP trades below $2 — is a textbook example. That headline (and the capital it describes) implies demand, but the market reaction has been far more muted than many expected. The question for allocators and ETF-focused traders is: why?
Two recent pieces frame the issue well: one reports the $1B+ into XRP ETFs while the price remained under $2 (reporting on ETF inflows), and others point to on-chain signals of supply under pressure and technical weakness (supply-in-loss analysis, moving-average and bearish indicator notes). Below I weave ETF mechanics with on-chain distribution and liquidity dynamics to explain the disconnect — plus practical scenarios traders can use.
ETF mechanics and where the demand lives
To start, remember how a physically backed ETF normally works. When demand for ETF shares grows, authorized participants (APs) can create new ETF shares by delivering the underlying asset (here, XRP) to the fund's custodian. That process should, in theory, reduce free-floating spot supply and be bullish for price because APs must either buy XRP from the open market or deliver existing inventory.
But there are important caveats:
- Not all ETF share purchases result in new-creation: secondary-market buying of ETF shares can be satisfied without an AP creating fresh ETF units.
- APs often supply ETF share creations from existing inventory or in-kind transfers, which may not require incremental buys in the spot order book.
- Institutional flows into an ETF can be accompanied by portfolio adjustments elsewhere (selling spot or moving inventory), which can neutralize the net buying pressure.
Those mechanics mean ETF inflows measured in dollars do not always map 1:1 to fresh market buys that lift the spot price. For traders used to watching flows into Bitcoin ETFs, the dynamics are similar in principle but differ in practice because of liquidity, market depth, and the concentration of holders.
Where the ETF demand went and why price stayed flat
The $1B+ headline matters — it signals demand and institutional interest. But the on-chain picture suggests two offsetting phenomena:
AP and institutional behavior can recycle existing XRP: if APs tap existing custodian stockpiles or institutions convert off-exchange balances into ETF allocations, there may be little incremental spot buying.
Whale distribution and supply-in-loss: on-chain metrics show a substantial portion of XRP supply sitting in loss after failed breakout attempts, and sending signals that large holders have been active. Reports indicate that despite ETF inflows, a material slice of supply is underwater and vulnerable to distribution (XRP supply-in-loss analysis). Technical indicators and moving-average pressure also point to selling (or at least weak re-accumulation) around resistance zones (technical weakness noted).
Put simply: ETF buys can be offset by whales selling or reallocating, or by creations that don't require fresh market buys.
On-chain whale distribution: how it offsets ETF demand
Whale distribution can take several forms that blunt price impact:
- Large wallets moving coins to exchanges for liquidity provision or OTC desks. If those flows coincide with ETF creation windows, selling pressure can match buys.
- Selling into the bid of retail or market makers at key resistance levels. Because whales control large amounts, they can absorb inflows by gradually distributing holdings.
- Using OTC desks to provide liquidity for APs or institutions, which circulates XRP without exerting upward price pressure.
On-chain tracking tools show increased movement among top addresses around recent ETF flows. That pattern is consistent with whales using the inflow narrative as an opportunity to distribute into perceived demand. Where supply sits in loss, the incentive to sell at break-even or small profits grows — especially when technical levels (like $2) act as magnet/resistance.
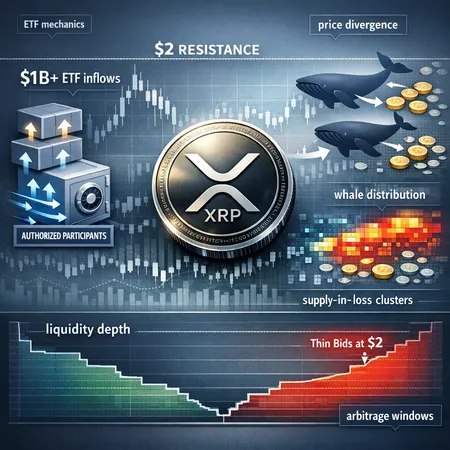
Liquidity depth at $2: why resistance holds
Every price level has two properties: trader psychology and book liquidity. The $2 mark for XRP has become both a psychological pivot and a zone with meaningful resting sell orders.
- Options and derivatives desks often gamma-hedge near round numbers, creating layers of defensive selling.
- Market makers post substantial offers to manage inventory risk; that depth can soak up ETF-driven bids without producing a breakout.
- If APs are sourcing XRP off-exchange or from custodian stock, the visible order book receives limited incremental buying pressure.
The result: substantial dollar inflows into ETFs can be absorbed without clearing the $2 resistance. That doesn’t mean the flows are irrelevant — it's just that the market structure (book depth, whales, AP sourcing) can neutralize their immediate price impact.
Arbitrage, AP behavior, and how ETFs can still move price
There are scenarios where ETFs do push price higher. Traders should watch for these signs:
- Net creation volumes that require open-market buys. If ETF share creations outpace what APs can supply from inventory, they must buy in the spot market, draining liquidity.
- Sustained secondary-market premiums. If ETF shares trade consistently above NAV, APs have an arbitrage incentive to buy spot and create shares — creating upward pressure on spot.
- Reduced whale selling or inventory re-accumulation. If large holders stop distributing and begin accumulating, ETF demand compounds with tightening supply.
For arbitrageurs, the trade is straightforward: monitor the ETF's premium/discount to NAV, watch AP creation/redemption notices (where available), and monitor on-chain flows into custodian addresses or large exchange inflows/outflows. Short windows of dislocation create scalps; longer-term imbalances can feed a breakout if net buys persist.
Tradeable scenarios for different players
For nimble arbitrageurs: track ETF share premiums, AP creation notices, and order book depth near $2. A persistent ETF premium plus thinning asks at resistance creates a low-risk arbitrage where buying spot and creating shares is profitable.
For ETF-focused traders: watch for structural signals — consecutive days of net new creations that cannot be satisfied by in-kind deliveries. Layer into trades when ETF creation data, combined with shrinking exchange reserves and reduced whale selling, align.
For allocators and longer-term holders: ignore single-day flow noise. Focus on on-chain supply-in-loss trends, accumulation patterns of non-exchange wallets, and macro liquidity conditions. Platforms like Bitlet.app can make staged allocations easier for institutional-size entries.
Practical indicators to watch in real time
- ETF daily creation/redemption reports (if published) and secondary-market premium/discounts.
- On-chain flows: custodial deposit addresses, large transfers to exchanges, and movements among top addresses.
- Exchange reserve trends: declining exchange balance is supportive; rising balances suggest distribution risk.
- Order book liquidity at $2: watch resting sell-side volume and options expiries that cluster at round numbers.
- Supply-in-loss metrics and realized losses among short-term holders — these highlight who is most likely to sell on spikes.
Combining these indicators reduces false signals. A headline about $1B+ of ETF flows is an important input; it is rarely a complete picture.
Bottom line: demand is real, but market structure and distribution matter
The $1B+ flowing into XRP ETFs proves institutional appetite exists, but where the demand resides and how it is executed determines whether it moves the spot price. AP behavior that uses inventory, whale distribution into inflows, shallow liquidity at key levels, and supply-in-loss dynamics can all blunt an otherwise bullish narrative. For traders and allocators, the winning edge is watching the plumbing: AP creations, on-chain whale flows, exchange reserves, and ETF premium/discount dynamics. Those are the signals that separate headlines from tradable trends.
Sources