Is Bitcoin Entering a Temporary Bear Phase? Liquidity, ETF Flows and Macro Signals to Watch
Summary
Executive snapshot
The BTC market has shifted from a simple “spot-ETF up = price up” narrative to a more nuanced regime where liquidity dynamics, ETF flows and macro cross-currents jointly determine the path forward. For many traders, Bitcoin remains the primary market bellwether, but recent weeks show how fragile a rally can become once flows and liquidity tilt the other way.
This piece is written for portfolio managers and long-term crypto investors deciding allocation and hedge timing into 2026. It synthesizes on-chain and flow signals, contrasts institutional outlooks, and presents scenario-based price targets with clear metrics to monitor — exchange balances, volatility compression/re-expansion, and spot ETF flows among them. Bitlet.app users accustomed to flow-driven strategies will find the metric checklist useful for tactical adjustments.
Where we stand: price action, ETF flows and liquidity
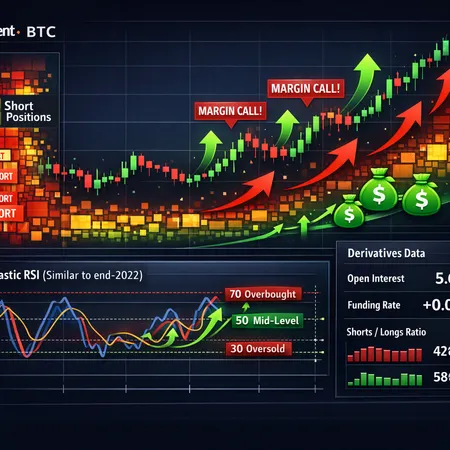
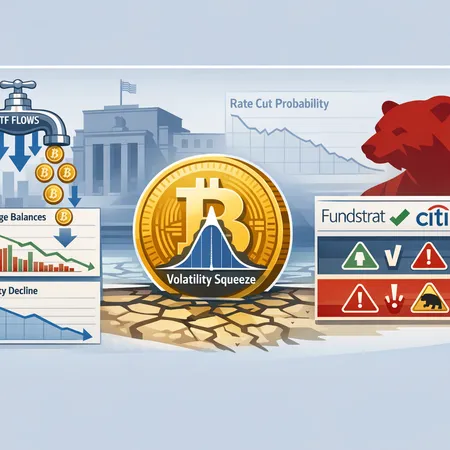
BTC’s recent corrections have coincided with noticeable spot ETF outflows and a drying of visible liquidity on centralized venues. Spot ETF flows matter beyond headline numbers: they are a proxied demand engine that can absorb or release supply into a thin market. When flows turn negative and exchange reserves stop declining, even modest sell pressure can push price lower.
Analysis arguing that bear-market fears grow as liquidity dries up and institutions step back highlights how market microstructure now amplifies macro and narrative shifts; when buyers retreat, algorithmic selling and stop cascades can accelerate declines. That dynamic is especially relevant for portfolio managers sizing exposures; the liquidity available at the market’s best bids is a different beast than headline market cap.
Macro cross-currents: Fed policy and the interest-rate backdrop
A key cross-current is the changing narrative around Fed easing. Recent reporting shows softening Fed rate-cut odds, which has repeatedly damped BTC rallies: when real rates or the probability of easier policy recede, risk assets often lose a tailwind. The classic playbook — easier policy supports risk assets — is still relevant, but the timing and certainty of cuts matter for how capital rotates into discretionary and illiquid allocations like BTC.
This is not a one-way street; a sustained pivot toward cuts would likely re-engage risk appetite and re-price the upside case. Until then, every attempt at a sustainable breakout will be measured against incoming US macro prints and shifting Fed communication, increasing the probability that strong rallies are short-lived if fund flows and liquidity don’t support them.
Institutional outlooks: bullish targets vs. systemic warnings
Institutional views diverge sharply. Some bullish projections — for example, analyst scenarios that place BTC far above current levels — remain widely cited as reminders of the long-term upside if adoption and demand continue. At the same time, other analysts warn that structural liquidity changes and reduced institutional participation could produce a multi-year correction or an extended grinding phase.
That divergence is actionable: optimistic forecasts can coexist with a near-term retracement if market microstructure and macro signals are unfavorable. For allocators, the implication is to separate strategic (multi-year) conviction from tactical sizing based on flow and liquidity metrics.
Scenario framework: bull / base / bear with price ranges and triggers
Below are scenario bands and the observable metrics that should influence tactical allocation decisions. These are not predictions but conditional paths tied to measurable thresholds.
Bull scenario — rapid re-acceleration
Price band: $100k–$189k (upper-end reflecting bullish institutional scenarios).
What needs to happen: sustained positive net spot ETF inflows, continued shrinkage in exchange BTC reserves, and re-acceleration of realized volatility (as buyers jump back in and liquidity providers widen participation). A macro catalyst — credible Fed pivot toward cuts — would amplify flows.
Metrics to watch (bull triggers):
- Net daily spot ETF inflows consistently positive for 30+ days.
- Exchange BTC reserves decline >5–10% over a rolling 30–90 day window.
- 30-day realized volatility re-expands above its multi-month average, indicating tradeable liquidity and willingness to take risk.
Context: Citi’s bullish projection is an example of a high-end institutional scenario; such targets are feasible if the flow and liquidity environment reverses quickly and sustainably.
(Reference: bullish projection discussed by analysts in industry commentary Citi projection).
Base scenario — range-bound with episodic drawdowns
Price band: $40k–$75k.
What to expect: intermittent rallies that fail to sustain due to episodic outflows or weak order-book depth. Macro data and Fed signaling remain ambiguous; ETF flows oscillate, with inflows offset by secondary selling.
Metrics to watch (base regime):
- Spot ETF flows alternate between modest inflows and outflows, net neutral on a 60–90 day basis.
- Exchange reserves stabilize but do not show structural declines; order-book depth remains shallow at large sizes.
- Volatility stays compressed with periodic spikes around macro prints.
Why this matters: in this regime, long-term allocators can maintain structural exposure but should be selective with incremental buys and consider systematic hedges (e.g., put spreads, reducing size during pronounced outflows).
Bear scenario — liquidity-driven washout
Price band: $15k–$40k (bottoming pressure into 2026 possible under severe liquidity stress).
What would cause it: a sustained reversal of ETF flows (persistent outflows), material increases in exchange reserves from deposit inflows, and continued volatility compression that gives way to sudden liquidity vacuums — all compounded by a macro environment that refuses to pivot.
Metrics to watch (bear triggers):
- Net cumulative spot ETF outflows over 30–90 days exceed a material threshold (e.g., meaningfully negative flows relative to AUM).
- Exchange BTC reserves increase materially as token supply returns to centralized venues for sale.
- Funding rates and open interest compress and funding turns negative for prolonged periods, indicating capitulation in leverage.
Context: several analyses have flagged the risk of a deeper correction if liquidity continues to evaporate and institutions pull back; some forecasts explicitly model a 2026 bear scenario and lower bottoming levels under these conditions (see CryptoBriefing’s discussion of 2026 bear risk).
(Reference: discussion of 2026 bear-market risk and expected bottoming ranges CryptoBriefing prediction).
Concrete signals and tactical checklist for portfolio managers
Use the following checklist to operationalize scenario judging and execution.
- Exchange reserves (on-chain): track percent change over 30/60/90 days. Declines signal supply withdrawal; increases signal potential selling pressure.
- Spot ETF flows (custodial inflows/outflows): monitor 7/30/90-day net flows and compare to ETF AUM to judge relative impact.
- Realized and implied volatility: watch for compression below historical averages (risk of violent breakouts) and divergence between implied and realized (cheap options can indicate complacency).
- Order-book depth at major venues: measure liquidity available at 1%, 3%, 5% price moves — shallow depth raises tail risk.
- Funding rates & derivatives open interest: negative funding and falling OI suggest deleveraging and lower risk-on participation.
- Macro indicators: Fed communication, US employment prints, and inflation surprises — these shape risk appetite and the likely path of flows.
Implement hedges or tranche buys tied to these signals rather than calendar-based rules. For example: scale into exposure as exchange reserves decline and ETF flows flip to net inflows; add hedges if daily cumulative ETF outflows exceed a predefined percentage of AUM and exchange balances rise.
Why liquidity compression matters more than headlines
Headlines about price targets or bullish narratives miss an essential point: markets are microstructured. When liquidity compresses — fewer resting bids, lower displayed depth — even modest selling pressures can magnify into outsized moves. This is different than a simple demand-supply equilibrium shift; it is a functional change in how orders interact.
That’s why monitoring exchange balances, order-book depth, and flow momentum is as important as following macro talk. Institutional forecasts may still assume a return of deep liquidity and investor appetite; if that assumption proves premature, price targets become tactical rather than strategic signals.
Practical takeaways
- Separate strategic conviction from tactical sizing. Long-term bullish views on BTC’s adoption can coexist with a tactical tightening of sizes as liquidity and flows deteriorate.
- Use measurable triggers (ETF flows, exchange reserves, volatility) to scale buys and activates hedges.
- Expect macro events — especially shifts in Fed policy expectations — to alter the flow backdrop rapidly. Softening cut odds have already shown capacity to sap rallies.
- Maintain scenario plans: bullish upside if flows and liquidity reverse, base case of range-bound action with episodic drawdowns, and a liquidity-driven bear outcome if outflows persist and exchange balances rise.
Final thought
For allocators heading into 2026, the decision isn’t binary: it’s conditional. Portfolio managers should translate institutional narratives into operational triggers and avoid anchoring to point forecasts alone. Watch the flows, watch liquidity, and let measurable thresholds guide tactical allocation and hedging decisions.
Sources
- How softening Fed rate-cut odds and US macro are damping recent Bitcoin rallies: Cointelegraph
- Analysis arguing bear-market fears are growing as liquidity dries up and institutions step back: Blockonomi
- Citi analysts’ bullish projection: NewsBTC (Citi projection)
- Forecasts and discussion of a 2026 bear-market possibility and expected bottoming levels: CryptoBriefing