Is Ethereum Completing a Wyckoff Accumulation — or Will Fed Uncertainty Kill the 2026 ETH Rally?
Summary
Executive snapshot
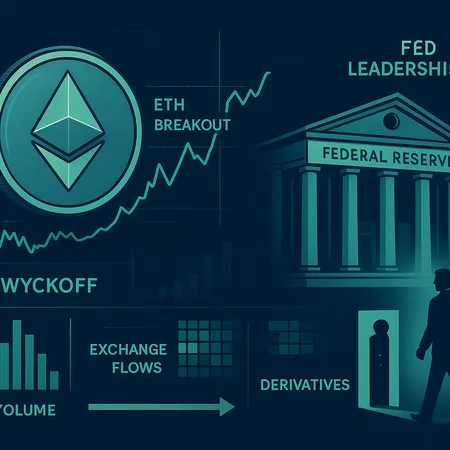
Is ETH quietly carving out a Wyckoff accumulation that leads into a multi‑year breakout — or is the rally hostage to Fed leadership changes and a potential Powell exit? The short answer: both narratives are plausible, and the market’s next months will depend on the intersection of on‑chain supply dynamics and macro policy clarity.
This deep dive walks through the structural clues traders watch (volume profiles, exchange flows, and derivatives), contrasts them with macro catalysts tied to Fed leadership, and closes with trade setups and a checklist to confirm a genuine ETH breakout toward five‑figure scenarios argued by some analysts.
For context, remember that Ethereum is simultaneously a financial asset and a fast‑evolving protocol — price structure reflects both capital flows and real network adoption (staking, L2 activity, DeFi usage).
Reading a Wyckoff structure in ETH price action
The Wyckoff method describes cycles of accumulation, markup, distribution, and markdown. A valid Wyckoff accumulation typically shows: a trading range after a prior downmove, diminishing spread and volume, a spring or shakeout that tests supply, followed by a Sign of Strength (SOS) and a markup phase.
What to look for in ETH:
- Compression and decreasing volume through the trading range — showing sellers drying up.
- A spring or climactic test where price probes below range support on high volume and is quickly absorbed.
- Net exchange outflows (indicating supply leaving hot exchanges) and rising custody into long‑term wallets or staking.
- Derivatives signals: funding rates neutralizing, open interest stable or rising only after price confirms strength, and options skew moving from put‑heavy (tail protection) toward balanced or call‑skewed structures.
Blockonomi recently argued ETH may be completing such a Wyckoff phase, pointing to structural price patterns and volume rhythms consistent with the late stages of accumulation (Blockonomi analysis). That’s an important, technically coherent read — but it’s not the whole story.
On‑chain evidence: volume and exchange flows
Volume profile: A classic accumulation often shows declining volume on down‑moves inside the range and rising volume on up‑moves. Traders should watch whether upticks in volume coincide with higher lows and shrinking upper wicks — that’s a practical SOS sign.
Exchange flows: Net outflows from spot exchanges over weeks/months are a bullish supply signal. If ETH is moving off exchanges into staking contracts or cold wallets, the available liquid supply for quick selling contracts — in theory — tightens. Recent market notes suggest smart money has been stepping in around key supports, with exchanges losing short‑term inventory (see NewsBTC for on‑chain reads about support holding and smart money activity) (NewsBTC market note).
Whale accumulation and staking: Rising balances in large wallets and increased staking participation remove ETH from float. These are not decisive on their own but complement a Wyckoff narrative when combined with price and volume patterns.
Derivatives positioning: skew, funding, and open interest
Derivatives give a forward‑looking window into trader sentiment and leverage.
Funding rates: Neutral to slightly positive funding shows equilibrium; large, persistent negative funding (shorts paid longs) suggests bearish demand. A Wyckoff accumulation often coincides with low, neutral funding before a markup when funding turns positive as longs re‑establish.
Open interest (OI): OI that rises only on up‑moves implies fresh longs entering on strength rather than marginal deleveraging. Watch for sudden OI spikes unaccompanied by price strength — that can be dangerous (blow‑offs and fragility).
Options skew and put/call ratios: A marked decline in put skew and a more balanced options surface implies diminished tail hedging and higher risk appetite — a helpful confirming indicator for a sustainable breakout.
Combining these data points creates a probabilistic view: the sum of declining sell‑side liquidity, neutral funding, and option market transition increases the chance the range is an accumulation rather than a distribution.
The macro wildcard: Fed leadership and the Powell exit risk
On the flip side, the macro environment — specifically central bank leadership and rate policy — can invalidate even the cleanest on‑chain setup. A change at the Fed, or credible talk of a Powell exit, is a real risk to cyclical, rate‑sensitive assets like ETH.
Crypto is not insulated from US monetary policy. Liquidity conditions, rate expectations, and the dollar’s path affect risk‑assets and margin financing.
Why leadership changes matter: Fed governors and the Chair influence forward guidance. Markets prize predictability; an unexpected change in leadership can create rapid repricing of rate expectations and volatility across equities, credits, and crypto.
Specific worries linked to a Powell exit: Powell’s communication style, credibility, and perceived willingness to pivot matter. A sudden leadership shift could force a steeper tightening path or inject uncertainty about the Fed's reaction function — both bad for risk assets. CryptoTicker has a focused piece examining how Fed leadership change could disrupt Ethereum’s 2026 rally and the transmission channels that matter most (funding markets, real rates, and risk premia) (CryptoTicker analysis).
Transmission into ETH: Higher real yields and tighter liquidity reduce the present value of long‑duration, expectation‑driven assets. Fast deleveraging can trigger liquidations in highly‑geared segments of crypto, amplifying downward moves even if on‑chain long‑term indicators look constructive.
Put simply: even a textbook Wyckoff accumulation can fail if macro liquidity tightens sharply or forward guidance becomes muddled.
Reconciling the narratives: conditional probabilities
Think in conditional terms. The on‑chain structure increases the conditional probability that a confirmed breakout leads to a sustained rally; macro shocks increase the probability of a false breakout or deep retracement.
A practical framework:
- Baseline: On‑chain + price structure indicate accumulation (higher conditional chance of markup).
- Challenger: Fed leadership volatility or an abrupt policy shift can reduce the size and duration of any markup or cause a speedy re‑accumulation at lower levels.
Because both are credible, traders should treat any bullish thesis as conditional on macro stability (clear forward guidance, no surprise leadership shock) and technical confirmation (volume, exchange flows, derivatives confirming).
Key support and resistance levels (rules, not gospel)
Traders need concrete bands to manage entries and risk. Exact numbers evolve, but here's a pragmatic set of levels to monitor as of a mid‑cycle technical map (adjust to live price):
- Primary support band (accumulation floor): roughly the lower range where smart money has historically bought — think of the $2,800–$3,200 area. This is the ‘spring/test’ neighborhood in many Wyckoff reads.
- Strong intermediate support: $3,500–$3,800 — useful for scaling buys on confirmed absorption.
- Immediate resistance (range top / SOS trigger): $4,200–$4,500. A weekly close above this band with rising volume is the first technical sign the trading range is failing to the upside.
- Major bullish confirmation band: sustained closes above $5,000–$5,500, accompanied by rising exchange outflows, positive funding turns, and options skew normalizing — that’s a practical gateway to the multi‑year markup scenario toward $10k.
- Higher‑timeframe sell zone: $6,000–$7,000 may contain liquidity from previous cycles and will likely produce retests before continuation higher.
Note: these bands are guidance. Trade sizing, stop distance, and timeframes should always reflect personal risk tolerance.
Trade setups and practical execution
Below are a few repeatable setups for different risk profiles. Incorporate position scaling and defined risk.
Conservative conditional breakout long (swing traders):
- Trigger: Weekly close above $4,500 with >30% week‑over‑week volume increase and net exchange outflows accelerating.
- Entry: 40–60% of intended position on week close; add remainder on a successful retest (weekly support hold).
- Stop: Weekly close back inside the range (or a fraction lower like 10–15% below entry).
- Targeting: first target near $6,500; stretch to $10k if macro and derivatives confirm.
Tactical accumulation (mean reversion / event risk):
- Trigger: Pullback into $3,000–3,800 with on‑chain evidence of absorption (large inflows to long wallets, diminishing exchange balance) and neutral funding.
- Entry: Scaled buys across the band with tight stops (5–8% per tranche).
- Rationale: If this is a Wyckoff spring/test, these levels offer low beta entries with favorable risk/reward.
Options directional (defined risk, skew plays):
- Strategy: Calendar or diagonal spreads to monetize low implied volatility ahead of a potential markup; call spreads after breakout to scale upside with limited capital.
- Risk control: Avoid naked exposure; watch the volatility surface and gamma risk around macro events (Fed announcements, leadership developments).
Defensive/hedged play for macro tail risk:
- Premise: If you’re long ETH but concerned about a Powell exit, hedge with short‑dated puts or buying inverse exposure in small size during high uncertainty windows.
Practical sizing: keep any single trade sized so a failed signal doesn’t force a blowup — e.g., 1–3% of portfolio per tactical position, 5–10% for a strategic swing depending on conviction and diversification.
Monitoring checklist to confirm a true ETH breakout
Use this checklist as a live dashboard. When multiple items tick, the probability of a sustained markup rises.
Market structure and flows
- Weekly close above the $4,200–4,500 band (range top) with expanding volume.
- Continued net spot exchange outflows for several weeks.
- Large wallet and staking inflows that reduce circulating float.
Derivatives & risk metrics
- Funding rates flip sustainably + and stay there without extreme short squeeze dynamics.
- Open interest rises primarily on up‑moves, not on down‑moves.
- Options skew normalizes (reducing put demand); call buying increases.
Macro inputs
- Fed forward guidance remains stable — no abrupt leadership decisions or hawkish pivots.
- Real yields stabilize or fall; dollar not entering a rapid leg higher.
- Equity risk appetite remains supportive (crypto tends to correlate with risk assets in liquidity episodes).
Behavioral confirmations
- Major market makers and smart money (on‑chain or OTC desks) publicly or privately show willingness to hold through retests.
- News flow supportive, not dominated by surprise policy events.
If the majority of these checkboxes are green, the Wyckoff breakout scenario gains real teeth. If macro boxes turn red (unexpected Powell exit, hawkish pivot), lock in profits or hedge.
Scenario mapping: practical probabilities and outcomes
- Bull case (~30–40% conditional): Wyckoff accumulation confirmed; ETH breaks above $5k with expanding on‑chain flows; markup accelerates and $10k becomes a multi‑year target as institutional and retail demand re‑align with protocol adoption.
- Base case (~35–45%): ETH breaks out but with periodic macro‑induced retests and choppy progression to higher targets; multi‑year rally occurs but takes longer and is punctuated by volatility.
- Bear case (~20–30%): Fed leadership shock (unexpected Powell exit or a materially more hawkish Chair) tightens liquidity; ETH fails the breakout, leading to rapid liquidation and re‑accumulation at lower levels.
These probabilities are directional and should be updated as new data arrives. The core point: plan for both the structural bullish case and macro hazard scenarios.
Practical notes for execution and risk control
- Time your option expiries and leverage to avoid exposure during FOMC windows and leadership announcements — gamma risk can be painful.
- Use position scaling: partial profits on the first major resistance, then trail stops to capture large moves while protecting capital.
- Keep liquidity buffers. If macro risk spikes, liquidity can dry and slippage can widen.
- Track exchange flows and open interest daily — derivatives moves often precede violent spot moves.
Traders using services like Bitlet.app to manage entries or construct financed positions should align trade size with both technical confirmation and macro event calendars.
Conclusion — a conditional bull thesis
Ethereum’s price structure shows several hallmarks consistent with a late‑stage Wyckoff accumulation: range compression, evidence of absorption near support, and on‑chain indicators that suggest supply is being taken out of instantaneous float. If the market confirms with a weekly breakout accompanied by rising volume, net exchange outflows, and healthier derivatives markets, the path to a multi‑year markup (and five‑figure ETH scenarios) becomes materially more plausible.
However, the Fed leadership question — particularly any credible noise about a Powell exit or an abrupt change in the Fed’s reaction function — is a legitimate systemic risk that can unspool a bullish technical setup. Always treat the bullish Wyckoff read as conditional: it needs macro stability to evolve into the large, long‑duration rally many expect.
For technical traders and macro investors, the right posture is asymmetric: plan for the markup with clear triggers and stops, but keep defensive instruments and a macro monitoring process ready to hedge or reduce exposure if policy uncertainty materializes.
Sources
- Blockonomi — "Is Ethereum quietly completing a Wyckoff phase ahead of a potential 10k breakout?" https://blockonomi.com/is-ethereum-quietly-completing-a-wyckoff-phase-ahead-of-a-potential-10k-breakout/
- CryptoTicker — "Will Fed leadership change disrupt Ethereum's 2026 rally?" https://cryptoticker.io/en/will-fed-leadership-change-disrupt-ethereums-2026-rally/
- NewsBTC — "Ethereum holds support" https://www.newsbtc.com/news/ethereum/ethereum-holds-support/