Is Bitcoin’s Break Above $93K the Start of a Run to $100K+? What Traders Should Watch
Summary
Quick thesis — what the $93K break means
For many traders, Bitcoin remains the primary market bellwether: a push above $93K has enough velocity to change narratives quickly. At face value the move looks like the start of an institutional‑led leg higher — driven by a mix of policy catalysts, concentrated ETF buying and the dynamics of derivatives markets — but momentum needs confirmation through flow and on‑chain metrics before accepting $100K+ as inevitable.
Immediate price drivers: policy, ETF flows and short squeezes
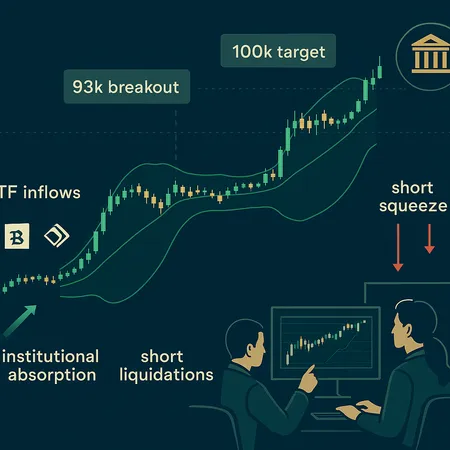
Three forces combined to lift BTC above $93K: a policy reversal that improved institutional optionality, persistent ETF inflows that absorb spot liquidity, and the technical squeeze dynamics among short positions.
Policy and institutional optics: A notable catalyst was Vanguard’s policy reversal, which the market quickly read as easing institutional constraints and increasing the conceivable pool of allocators; analysts tied this change directly to the recent rally and bid urgency among allocators (crypto‑economy.com).
ETF flows and institutional absorption: Spot and futures ETF flows can eat into available float and create sustained price pressure if sustained. When large managers route new allocations through ETFs, the result is incremental spot demand that is harder to fade intraday than retail buys. Traders should watch daily net flows, creation/redemption patterns and ETF AUM updates as a near‑real‑time gauge of absorption.
Short squeeze mechanics: A breakout above a crowded short level can trigger cascades. Several analysts argue the $93K test has set the stage for a short squeeze as leveraged shorts are forced to cover, accelerating price action (see the breakout narrative and reaction coverage in the market) (NewsBTC).
These drivers are not mutually exclusive — ETFs can create the backdrop of scarce liquidity while a policy shift and short covering provide the ignition.
Technical roadmap: signals, levels, and measured moves
Technicals give a clear roadmap for near‑term targets and pivot levels.
Bollinger bands and volatility regime: Late‑2023 and early‑2024 Bollinger band expansions signaled a sustained volatility regime; current bandwidth and band slope are consistent with momentum that wants to extend if the price holds above the upper band. Cointelegraph’s review of Bollinger‑based parabolic signals provides useful context for why a band breakout favors continuation when supported by flows (Cointelegraph).
Immediate support and resistance: After the $93K breach, logical short‑term support sits in the $88K–$91K band where most recent volume nodes accumulated; below that, a retest of the $80K–$85K range would be material. Upside, $100K is the psychological and technical first target, while a measured move from the consolidation zone points toward ~$105K as the next logical objective, aligning with technical work on breakout projection (CryptoPotato).
Measured move and time frame: If the breakout is genuine and daily closes above $93K persist for several sessions with expanding volume, many technical traders will use a measured move from the width of the prior accumulation to project toward $105K. Shorter time‑frame traders should monitor intraday Bollinger band reversion signals for pullback entries.
On‑chain and positional indicators to watch
Price is only half the story; trader positioning determines how cleanly a move can continue.
Short liquidations and funding rates: Sudden spikes in long funding or rapid decreases (toward extreme negative funding) are signs of short covering or long exhaustion. Watch exchange open interest and funding rates; a falling open interest while price rises suggests short covering without fresh long participation — a fragile rally.
Short‑term holder (STH) behavior: Recent analysis shows a potential STH shakeout could accelerate the recovery if forced sellers capitulate and stop resisting the move up. A meaningful transfer of coins to exchanges from STHs or elevated realized losses among STH cohorts can indicate capitulation phases that precede sustainable rallies (Decrypt).
On‑chain flow metrics: Net inflows to custodial wallets and ETF creation figures are concrete signs of institutional absorption. Monitor dormant coin movement, exchange balances, and large wallet activity; persistent withdrawal from exchanges into cold storage or custodial ETF baskets supports continuation.
Macro tailwinds: why the backdrop may favor continuation
Macro momentum matters more for sustained runs than for one‑off squeezes.
Rate‑cut expectations: Markets are pricing a drift toward easier policy over the next 6–12 months. Lower real yields historically improve the risk‑allocation case for BTC as an alternative store of value. If durable rate‑cut expectations firm, institutions may reweight toward BTC allocations, supporting higher equilibrium prices.
Liquidity and risk appetite: Combined with ETF accessibility and policy signs, easier global liquidity could amplify the effect of institutional buying. That said, macro expectations can flip; traders should treat them as conditional tailwinds rather than guarantees.
Downside scenarios and risk management
Not every breakout sustains. Here are realistic failure modes and how to manage them.
Failed breakout / fakeout: If price fails to reclaim $93K on a daily close and volume evaporates, expect a rapid retest of $88K or lower. In this case leveraged longs are vulnerable; position sizing should assume a stop under the low of the breakout range.
Flow exhaustion: ETF inflows can plateau. If inflows slow while derivative positioning remains long, the market may see mean reversion into the flow unwind. Monitor ETF creation/redemption and AUM updates as early warning signs.
Macro shock: A sudden tightening surprise or geopolitical risk that drains risk appetite can send BTC back toward the 200‑day or prior structural support levels. Have contingency hedges or trailing stops.
Liquidity cliff from concentrated selling: If a handful of large holders decide to rotate into profit, the market could face clustered supply that overwhelms marginal buy pressure. Watch large transfer events and on‑chain exchange deposits.
Practical trade framework for active traders and allocators
A few actionable rules to size positions and manage risk around this move:
Define the thesis window: Are you playing for a short‑term squeeze (hours/days) or for a multi‑week institutional leg? Entry sizing and stop logic differ materially.
Use layered entries: Scale in on pullbacks to the $90K–$91K zone if the market rechecks, or use intraday mean‑reversion bands for tighter swing entries. Avoid all‑in entries on the first breakout candle.
Stops and targets: For swing positions, consider stops beneath the $88K pivot with partial profit taking at $100K and further trimming toward $105K. For scalps, rely on intraday Bollinger reversion and funding rate signals.
Watch derivatives tape: Enter when funding is neutral to slightly positive (suggesting balanced longs) and when open interest is rising alongside price — that signals fresh participation rather than pure short covering.
Portfolio context: For portfolio managers, treat BTC as a rate‑sensitive risk asset; size allocations to reflect macro exposure and liquidity needs, and consider dynamic rebalancing rather than static add-ons during breakouts. Tools on platforms like Bitlet.app can help track ETF flows and manage P2P exposure.
Conclusion — likely path and what confirms the move
A clean path to $100K+ is plausible if ETF flows persist, institutional absorption continues, and short covering is followed by fresh long participation. The $93K breakout is a meaningful technical pivot, and Bollinger band expansion supports continuation if corroborated by rising volume and on‑chain signs of demand.
What will make the call obvious? Sustained daily closes above $93K with expanding exchange outflows, rising open interest, and neutral/positive funding rates — that combination indicates institutional absorption and genuine buyer participation. Conversely, a quick return below $90K, waning ETF inflows, or rising exchange deposits would argue the move was a squeeze and not the start of a sustained leg.
For active traders and allocators, the trade is about evidence: measure flows, monitor funding and liquidations, use disciplined stops and layering, and treat $100K as an achievable first target with $105K as a higher measured‑move objective if the technical and on‑chain narrative stays intact.
Sources
- https://www.newsbtc.com/bitcoin-news/93k-and-climbing-analysts-say-bitcoins-push-to-100k-has-begun/
- https://cryptopotato.com/heres-bitcoins-next-big-target-after-93k-breakout-attempt/
- https://decrypt.co/350741/bitcoin-short-term-holder-shakeout-could-accelerate-recovery-above-key-level
- https://crypto-economy.com/vanguards-policy-reversal-sends-bitcoin-soaring-to-93k-amid-macro-tailwinds/
- https://cointelegraph.com/news/bitcoin-bollinger-bands-parabolic-bull-signal-from-late-2023?utm_source=rss_feed&utm_medium=rss%3F_q%3D1764754415636%26__%3D1764754415636%26sid%3D2147c13a1ebac3fd&utm_campaign=rss_partner_inbound


