December 11 Mining Difficulty Rise: What It Means for Miners, Hash‑Rate and Price
Summary
Quick primer: what the December adjustment is and why it matters
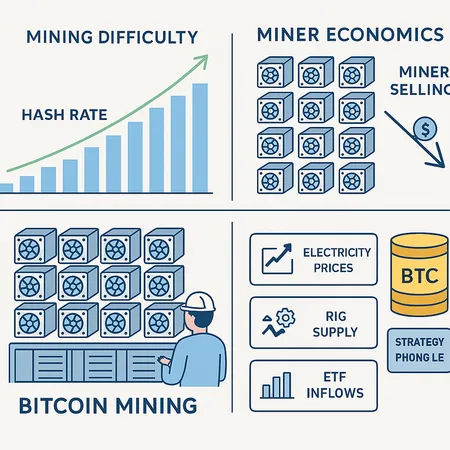
Bitcoin mining difficulty is the protocol’s automatic knob for keeping block times near 10 minutes. When more hash power comes online, difficulty increases; when hash power falls, difficulty falls. A scheduled adjustment on December 11 is widely expected to be a material rise, the kind that changes the math for marginal miners and alters short‑term supply dynamics. Analysts tracking networks and rig deployments flagged this timing and magnitude in recent coverage, with predictions of a meaningful uptick in difficulty on the December 11 adjustment see reporting here.
For analysts and advanced retail investors, a single large difficulty step isn’t just a technical footnote. It affects miner economics, which in turn influences how much BTC miners choose to sell, how long older rigs remain online, and ultimately how supply responds to price shocks.
1) Drivers of the predicted rise: hash‑rate surges and ASIC deployments
Hash‑rate growth: seasonal and structural drivers
Hash‑rate rises because new ASICs come online, existing rigs get tuned for better uptime, or mining farms expand. In recent months on‑the‑ground reports and pool telemetry showed elevated hash‑rate additions as miners bring winterized farms back online and new shipments arrive. That coordinated increase is the primary proximate cause of the expected December adjustment.
ASIC refresh and rig supply
Large ASIC shipments — newer, more efficient models from major manufacturers — push network difficulty faster than organic growth from legacy equipment. When operators upgrade to machines with higher TH/s per watt, they effectively add more usable hash per rack. This can be a discrete trigger if many farms receive shipments in the same window.
Other drivers: pool dynamics and miner competition
Mining pools and high‑frequency rebalancing between them can amplify observable hash‑rate jumps. A few high‑capacity farms coordinating maintenance windows and re‑syncing can create a clustered increase in the network hash‑rate that shows up as a single, sharp difficulty rise.
2) Short‑term economics: margins, fee revenue, and selling pressure
What changes on day one
A difficulty rise reduces the expected BTC per TH/s for every miner. If BTC price and fee income stay flat, USD revenue per unit hash falls proportionally to the difficulty increase. For an example: a 10% difficulty rise with no change in price/fees means roughly 10% less BTC produced per unit hash over the next adjustment period.
Miner margins and breakevens
Margins depend on three variables: BTC revenue (block subsidy + fees), electricity and operating costs (USD), and capital amortization. Older rigs with higher power draw and lower hash output see margins compress first. Operators running inefficient machines may decide to idle rigs or sell them on secondary markets rather than operate at a loss.
Fee revenue: a possible short buffer, but unreliable
Fee income can offset part of a difficulty‑induced revenue drop, but fees are volatile and driven by user activity, not miners’ costs. If mempool activity spikes, fees can help margins temporarily — otherwise miners rely on BTC issuance and stable price.
Miner selling dynamics
When margins compress, miners have a few options: hold reserves and wait, tap credit lines, sell BTC to cover OPEX, or shut off rigs. In a tight margin episode, short‑term miner selling tends to rise. But the size and timing of those sales vary by operator balance sheet and institutional backing. Institutional miners and funds may be more inclined to HODL, or to only sell as a last resort, shifting the expected supply response (more below).
3) Institutional holders, funds, and how that changes miner behavior
Institutional actors change the supply equation two ways: they can absorb miner sales, and they can alter miners’ own disposition toward selling.
Phong Le, CEO of Strategy, framed a common institutional stance: selling BTC is viewed as a last resort rather than routine liquidity management (full comments covered in reporting here). That cultural or policy constraint matters; if large custodial funds and institutional miners prefer not to liquidate during tight patches, selling pressure gets muted and price impact lessens see context in this interview/report.
But institutions are not monolithic. Some miners have hedging programs, margin facilities, or revenue forward sales that obligate periodic liquidations. Others operate with multi‑month BTC reserves and credit lines that allow them to weather a difficulty spike without selling. The net selling response will therefore be heterogeneous — and that heterogeneity is crucial to price impact models.
4) Where to watch next: on‑chain and macro indicators that change the outlook
Below are the high‑signal items to monitor now that a jump in difficulty is imminent.
On‑chain signals
- Miner balances on exchanges and in cold wallets: rising transfers to exchanges historically signal increased selling intent; growing off‑exchange balances suggest HODL. Track daily change and accelerating trends.
- Pool hashrate distribution and pool inflows/outflows: sudden rebalancing can indicate operational shifts.
- Mempool size and fee per byte: higher fees can temporarily cushion miner revenue.
- Difficulty and hashrate estimators: daily rolling averages smooth noisy spikes; watch both 3‑day and 14‑day trends to see persistence.
Operational and supply indicators
- Rig delivery schedules: shipment manifests and public statements from Bitmain, MicroBT and other manufacturers indicate future capacity increases. A wave of inbound modern ASICs will keep difficulty elevated.
- Secondary market prices for used ASICs: falling resale prices are an early warning of margin stress.
- Electricity price data in major mining regions: sharp jumps in industrial power rates (or curtailment risk) can push marginal miners offline.
Macro indicators
- ETF flows and broader institutional demand: large inflows into spot ETFs act as a counterweight to miner selling; outflows amplify price pressure.
- Central bank commentary and policy risk: macro shocks change demand and financing costs. Notably, Fed communications can swing short‑term risk appetite; some analysts suggested Fed Chair Powell’s early December remarks had the potential to influence the next BTC major move by affecting market discount rates and miner financing costs (read more on that linkage here) Blockonomi analysis.
Practical watchlist (short checklist)
- Change in miner balances to exchanges (24h/7d).
- 7‑day rolling hashrate vs. previous adjustment period.
- Used ASIC listings and pricing trends.
- Mempool fees and count of high‑fee transactions.
- ETF inflows/outflows and large custody movements.
Scenarios: how the December adjustment could play out
A. Transient compression (base case)
Difficulty rises, marginal rigs idle, but BTC price or fees recover within weeks. Selling is modest; institutional HODL behavior helps. Network hash stabilizes and difficulty plateaus.
B. Deeper capitulation (bearish tail)
Difficulty rises and BTC price falls or remains stagnant, forcing more miners to sell to cover OPEX. Used rig prices tumble, pushing a cascade of shutdowns and sustained downward pressure on price.
C. Durable hash‑rate growth (bullish from supply side)
Higher difficulty reflects efficient new capacity; miners have stronger balance sheets and institutional demand absorbs any incremental selling. Greater real supply constraint results, potentially bullish for price if demand is stable or rising.
Tactical takeaways for analysts and advanced retail investors
- Don’t treat the December 11 difficulty rise in isolation. It’s a symptom of hash‑rate dynamics and rig economics that are already in motion.
- Watch miner exchange flows and used ASIC markets for leading signals of selling pressure.
- Consider financing and hedging behaviors: miners with accessible credit lines or revenue forwards are less likely to sell spot BTC into a dip. Institutional rhetoric — like Phong Le’s — is informative but not determinative.
- Keep an eye on macro inflection points that change funding costs and demand (Fed moves, ETF flows). These can turn a localized supply shock into a market‑wide move.
In short: December’s difficulty adjustment matters because it converts behind‑the scenes technical capacity into real economic pressure on miners. For investors trying to anticipate structural supply shifts behind BTC price moves, combine on‑chain miner metrics with rig supply and macro indicators. Services like Bitlet.app operate in this broader ecosystem, and understanding miner incentives helps you place short‑term market moves into a longer‑term supply‑side narrative.
Sources
- "Bitcoin mining difficulty rise in December" — Cryptopolitan: https://www.cryptopolitan.com/bitcoin-mining-difficulty-rise-in-december/
- "Strategy: sell Bitcoin only as a last resort" — Cointelegraph: https://cointelegraph.com/news/strategy-sell-bitcoin-last-resort-mnav-capital?utm_source=rss_feed&utm_medium=rss%3Fcb%3D9olu54%26_refresh%3D9olu54%26noCache%3Dtrue%26_q%3D1764497928642&utm_campaign=rss_partner_inbound
- "Powell's December 1 speech could determine next Bitcoin major move" — Blockonomi: https://blockonomi.com/powells-december-1-speech-could-determine-next-bitcoin-major-move/
For market participants monitoring the supply side, check pool telemetry, miner wallet flows and rig shipment news daily — these are the fastest signals that a difficulty shock is changing real‑world miner behavior. Also, for background context on long‑term miner incentives and market dynamics, follow Bitcoin coverage and on‑chain analytics providers for the latest charts.


