Was 2025 a Crypto Bear Market? A Data-Driven Verdict for BTC and ETH
Summary
Framing the question: what makes a "bear market" in crypto?
“Bear market” is a deceptively simple label. For traditional equities, academics often use peak‑to‑trough declines of 20% or more plus a sustained period of negative returns. In crypto, the lexicon is messier: volatility is higher, flows can reverse quickly, and concentrated institutional action (like ETF inflows or outflows) can distort short‑term price discovery. So when does a sharp drawdown become a regime change rather than a correction? This piece looks at four evidence streams — price drawdowns for BTC and ETH, ETF/institutional flows, exchange premium/discounts as a capital‑flow proxy, and market‑structure / technical reads — and then sketches plausible 2026 scenarios.
What happened to BTC and ETH in 2025 (a concise data view)
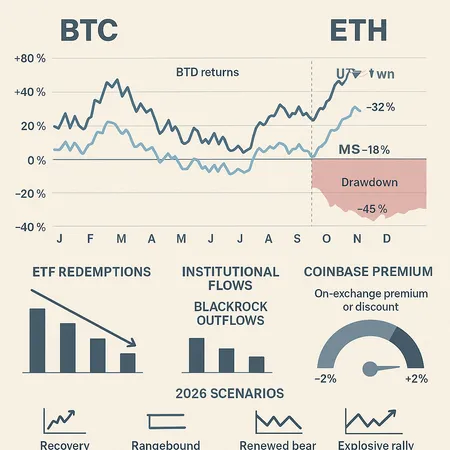
Price action: Both BTC and ETH endured material declines after October’s flash crash. Across market commentators and exchange data, the common read is a mid‑year to post‑October drawdown in the range of roughly 25–45% from local 2025 highs for BTC, with ETH generally recording similar or slightly larger percentage drops. Those ranges capture variability across data feeds and exact peak dates, but they convey the scale: sizeable, meaningful retracements rather than micro‑corrections.
Year‑to‑date context: Despite the drawdowns, parts of 2025 still showed positive stretches earlier in the year. That mix — strong gains earlier, sharp selloff in October, partial recovery afterward — is central to the debate about whether the year should be labeled a bear market.
For many traders, Bitcoin still functions as the primary market bellwether; reading BTC and ETH together offers the clearest regime signal.
Institutional flows and ETF redemptions: real risk transfer or noise?
Institutional capital matters. In 2025 the ETF ecosystem matured further, and institutional behaviour sometimes amplified the drawdown. CryptoBriefing documented a concrete example of de‑risking: BlackRock clients offloaded about $114 million of Bitcoin during the visible volatility window, a flow that underscores how professional allocation decisions can exacerbate moves rather than steady them (see the reporting on those outflows).
ETF redemptions have two implications:
- On the mechanical side, sustained net outflows from spot ETFs reduce a persistent source of bid liquidity that helped prior rallies. That can make markets more brittle.
- On the informational side, redemptions reveal risk‑off behavior among larger, arguably more sophisticated holders; when those actors reduce exposure, it often signals a reassessment of near‑term convexity.
Still, timing and scale matter. A single two‑ or three‑week redemption episode—even if sizable—doesn’t define a full year. What matters more is whether outflows persist across quarters and whether they coincide with other structural indicators pointing to a lasting regime shift.
Coinbase premium and on‑exchange spreads: a capital‑flow thermometer
A useful high‑frequency proxy for cross‑border retail and institutional demand is the exchange premium/discount — how much BTC trades on a particular exchange (or in a market) relative to a global reference price. On Nov 29, CoinDesk reported that the Coinbase premium flipped positive, a signal often read as renewed U.S. dollar capital chasing Bitcoin and a short‑term bullish indicator.
Why it matters: when Coinbase (a primary on‑ramp for U.S. flow) trades at a premium, it suggests U.S. buyers are willing to pay up — a sign of fresh demand. Conversely, persistent negative premiums often show local sellers or exit liquidity. Think of these premiums as a real‑time capital‑flow thermometer: they don't prove long‑term regime change, but they can tip the balance between a relief rally and a sustainable recovery.
Technical and structure reads: is there a local bottom?
Technical analysts offer quicker verdicts. Some are explicit: a recent analyst note compiled by Cointelegraph argued BTC may be forming a short‑term bottom with a potential relief rally toward $100–110k. Those calls are grounded in pattern recognition and momentum metrics, and they can be self‑fulfilling if enough market participants act on them.
But technicals have limits. A relief rally that retraces a portion of losses does not by itself invalidate a bear market if macro and flow signals remain adverse. The proper synthesis: treat technicals as near‑term guidance rather than the sole regime determinant.
Putting the pieces together: a balanced read
Combine the evidence and a nuanced picture emerges:
- The depth of the October drawdown and documented institutional de‑risking (e.g., BlackRock client redemptions) point to real stress in market internals. These are bear‑ish elements.
- Offsetting that, the flip in Coinbase premium and technical calls for a local bottom are constructive and suggest buyers stepped back in after the crash.
- Year‑to‑date returns being mixed — with some earlier gains and a sharp late‑year drawdown — make 2025 neither a clean capitulation cycle like 2018 nor a textbook bull year.
If you prefer binary labels, you can argue either side. Objectively, 2025 looks like a hybrid year: one defined by a meaningful drawdown and institutional de‑risking episodes, but also by intermittent demand signals and technical evidence for relief. The result is a market that experienced bear‑like stress without an across‑the‑board structural collapse.
Four plausible scenarios for 2026 (and what they mean for allocation)
Below are four concise scenarios that capture broad regimes next year, with practical implications for portfolio positioning.
1) Recovery and structural resume (Base case)
- What happens: ETF flows stabilize or return net positive, Coinbase premium stays neutral/positive, technicals break higher and BTC/ETH exceed prior mid‑2025 highs. Institutional risk appetite normalizes.
- Probability: Moderate.
- Implication: Rotate modestly toward risk assets. Consider increasing crypto allocation gradually (dollar‑cost averaging), keeping a portion in liquid stablecoins to seize tactical entry points.
2) Protracted choppy market (Rangebound)
- What happens: Flows oscillate (inflows then outflows), Coinbase premium vacillates around zero, price action remains contained in a broad range. No decisive macro catalyst.
- Probability: Moderate‑high.
- Implication: Favor active strategies — volatility strategies, yield farming in short‑duration DeFi instruments, and rebalancing rules to harvest volatility. Lower conviction long‑only exposure.
3) Renewed capitulation (Bear intensifies)
- What happens: ETF redemptions persist and broaden beyond episodic outflows (more institutional de‑risking like the BlackRock case), on‑exchange discounts deepen, and technicals break down to new lows.
- Probability: Low‑to‑moderate.
- Implication: Defensive posture. Increase cash/stablecoin allocation, reduce leverage, and prioritize quality (liquidity and network fundamentals). Use option hedges or layered stop rules.
4) Risk‑on acceleration (Macro tailwind)
- What happens: External macro catalysts (credit easing, institutional adoption headlines, or regulatory clarifications) spark a broad rotation into risk assets; ETFs see sustained inflows.
- Probability: Low but plausible.
- Implication: Tactical overweight in BTC/ETH and selective alt plays; tilt toward growth‑oriented DeFi exposure and allocator strategies that can scale into momentum.
Practical decision framework for investors and strategists
- Read flows and premiums together: treat ETF redemptions (e.g., the documented BlackRock client outflows) as signal, then verify with on‑exchange premiums like Coinbase and order‑book depth. If both move bearish, treat allocation reductions more seriously.
- Use technicals for timing, not regime calls. Analyst views suggesting a local bottom — like those targeting $100–110k — are useful for tactical entries but should be layered with flow and macro checks.
- Size for optionality: maintain a core allocation you won’t rebalance out of during volatility, plus a tactical sleeve sized for 5–15% of crypto portfolio to capitalize on regime shifts.
- Liquidity matters: keep a portion in high‑liquidity instruments (spot, liquid ETFs, stablecoins) to exploit dislocations.
Bitlet.app users who are building installment or earning strategies should weigh these regime signals when choosing cadence and risk limits.
Verdict: was 2025 a bear market?
Short answer: Not definitively, but it contained bear‑market characteristics.
Longer answer: 2025 combined meaningful drawdowns and institutional de‑risking with renewed signs of buyer interest and technical bases forming. That combination produced a hybrid year — one that carried bear‑like episodes but stopped short of a full structural breakdown across the entire market. For allocation, the prudent stance is neither full defensive retreat nor aggressive redeployment: favor flexible sizing, readflows closely (ETF redemptions and exchange premiums), and use tactical technical signals for timing.
Sources
- Was 2025 actually a bear market for crypto? Here's why it’s complicated (The Motley Fool)
- BlackRock clients offload $114 million of Bitcoin (CryptoBriefing)
- Coinbase premium flips positive in hope for Bitcoin bulls (CoinDesk)
- Analyst: Bitcoin may be forming a short‑term bottom toward $100–110k (Cointelegraph)


