Chainlink Technical Primer: Is LINK Poised for a 16% Bounce to $16.50 in Two Weeks?
Summary
Quick market context and the setup
Chainlink (LINK) has pulled back sharply into areas many traders watch for mean reversion: support levels around the recent low and the lower Bollinger Band. Short-term commentary and technical pieces are already flagging a potential 16% pop to $16.50; for instance, a technical note summarized by Blockchain.News frames that level as a reachable target when Bollinger Bands are oversold.
At the same time, on-chain and price reporting shows a clear retrace — The Currency Analytics recorded LINK dipping to about $14.51 and debated whether the structure will hold, which is central to the bearish countercase (structure risk) that we’ll unpack below: https://thecurrencyanalytics.com/altcoins/chainlink-approaches-critical-zone-as-traders-weigh-possible-rebound-212948. Market-wide emotion is also a big factor right now: the Fear & Greed Index sits in extreme fear, a condition often associated with oversold capitulation and sharp technical bounces (Cryptopolitan).
Many traders still watch Chainlink because oracles remain a core DeFi plumbing piece; their movement often carries outsized attention across the DeFi ecosystem. Below I translate the noise into a structured, actionable technical plan.
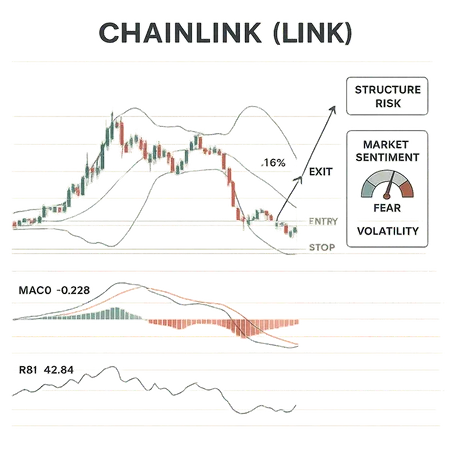
Technical snapshot (what to read on your chart)
Support levels: The immediate demand zone is the recent swing low near the $14.4–$14.8 band (the level cited by market commentators). Below that sits a more meaningful structural support (previous multi-week lows) — a break under those levels widens the bearish scenario.
Bollinger Band: LINK has touched or pierced the lower Bollinger Band on the daily, a textbook mean-reversion signal when combined with other oversold indicators. The external prediction to $16.50 leans on this exact lower-band oversold thesis.
RSI and momentum: Current reporting refers to oversold price action — typically RSI beneath 30 on most timeframes — which supports a potential bounce. RSI alone is not a trigger; look for divergence or a re-acceleration above a short-term threshold (e.g., 30→40) for confirmation.
MACD: Expect a negative MACD line if the pullback is recent; traders hunt for a slowing histogram or a bullish MACD crossover on lower timeframes as early confirmation. If MACD remains strongly negative and widening, the bounce thesis weakens.
Volume: A bounce that matters should show higher-volume spikes on green candles. Low-volume pops are often retested and fail.
Put together: the chart shows oversold conditions that favour a mean reversion; however, the integrity of nearby structure (the $14.4–14.8 zone) is the fulcrum.
The bullish case for a 16% short-term rebound
Mean reversion from an oversold lower Bollinger Band. When daily price touches the lower band while broader sentiment is capitulatory, it often leads to quick technical bounces. The prediction to $16.50 cited above explicitly models that behavior.
Extreme sentiment kneecap. When the Fear & Greed Index is in extreme fear, retail capitulation and liquidations can create both the washout that shorts expect and the sharp counter-trend bounce that technical traders can exploit. See the recent breakdown explained by Cryptopolitan.
Clear target and favorable R:R for a short swing. From a $14.5-ish fill, a $16.50 target represents ~13–16% upside — a meaningful, defined target that many short-term setups can reach if momentum flips and volume supports the move.
Macro liquidity and correlation windows. If larger risk assets stabilize, altcoins with strong narrative utility like LINK can rally quickly as liquidity rotates back in.
These factors combine to make a disciplined, size-controlled long swing reasonable for intermediate traders — if you respect structure and risk.
The counterarguments and structure risk
Failure of the $14.4–$14.8 support zone. The most important risk: if price closes decisively below recent multi-week lows, the bounce thesis collapses. That would invalidate the short-term target and open the door to a deeper corrective sequence.
Momentum still bearish (MACD/volume). If the MACD continues to deepen and momentum accelerates to the downside, oversold indicators can remain oversold for longer — producing range-bound chop or lower lows instead of a clean rebound.
False bounces and low-volume rallies. In extreme fear environments, relief rallies often occur on low volume and fail fast; the lack of volume is a common trap.
Macro volatility and derivatives risk. Sharp moves in BTC or liquidations during volatility events can blow through stop clusters and make tight setups fragile.
The currency analytics piece underscores this debate about whether the structure will hold and emphasizes why a binary decision around the $14.5 area is critical: https://thecurrencyanalytics.com/altcoins/chainlink-approaches-critical-zone-as-traders-weigh-possible-rebound-212948.
A trader-ready plan: entries, scaling, and exits
The rules below are pragmatic for intermediate technical traders who want a defined edge while controlling risk.
Strategy A — Aggressive short-swing (higher probability, moderate risk)
- Entry: limit buy in the $14.4–$14.8 demand zone (scale 50% of intended size at $14.8, add 25% at $14.5, final 25% at $14.2 if touched).
- Stop placement: initial stop below the structural low — e.g., 3–6% beneath the lowest fill depending on volatility. Example: if your average fill is $14.6, stop at $14.10 (~3.4% risk).
- Targets: first take-profit (TP1) at $15.60 (about +7%), TP2 at $16.50 (about +13–16%). Scale out (25–40% at TP1, remainder at TP2).
- Risk management: risk no more than 1–2% of portfolio on the trade. If risking 3.5% to stop (size-adjusted), keep position size so portfolio risk ≤1–2%.
This plan earns a favorable R:R if TP2 is realized and allows nimble exits if the trade fails.
Strategy B — Conservative confirmation entry (lower risk)
- Entry: wait for confirmation — a clean daily close above a short-term resistance (e.g., $15.20–$15.40) with rising volume and a bullish RSI bounce above 40.
- Stop: place stop under the breakout candle low (tight, e.g., 2–3%).
- Targets: same TP1/TP2 ladder; lower position size since this is a later entry with confirmation.
This reduces the chance of being caught in a false bounce but costs missed early upside.
Alternatives: options or defined-risk instruments
If available, consider buying calls or call spreads that cap downside and allow for leveraged upside; the premium can be expensive during extreme fear and IV spikes, so model breakevens carefully.
Stop placement nuance and expected volatility
- Stops must respect structure, not noise. Avoid placing stops inside obvious wick space; put stops beyond the last meaningful swing low plus a buffer for volatility.
- Buffer sizing: use ATR or recent candle ranges. For example, if the daily ATR is $0.70 on LINK, a 1x–1.5x ATR buffer (~$0.70–$1.05) beyond the swing low prevents being stopped by normal noise.
- Account for liquidity: on pairings with wide spreads, slippage can eat into small risk budgets — adjust stops and size accordingly.
Because market sentiment is in extreme fear, expect higher realized volatility. That increases the odds of rapid moves both up and down; position sizing and wider structural stops help survive the chop.
Risk-reward math: example
- Capital: $100,000 account, willing to risk 1% ($1,000).
- Aggressive plan: average fill $14.60, stop at $14.10: per-unit risk = $0.50. Position size = $1,000 / $0.50 = 2,000 LINK units (notional $29,200). If TP2 at $16.50 hits, profit per unit = $1.90 → profit = $3,800 (~3.8% account gain on that single trade). A 1:3.8 R:R in the best-case scenario.
Always round sizes to exchange limits and respect leverage safety margins.
How market sentiment amplifies outcomes
Sentiment is a multiplier. When the Fear & Greed Index is in extreme fear, the market tends to produce larger intraday swings and sharper mean reversion events. That means:
- Bounces can be faster and larger if a coordinated liquidity rotation occurs.
- Conversely, breakdowns can be swift and trigger cluster stops below obvious supports.
Use sentiment gauges to adapt trade posture: in extreme fear, prefer confirmed entries or smaller size with wider stops. See the recent sentiment read for context at Cryptopolitan.
Exit rules and post-trade hygiene
- Take partial profits at predefined TPs; don’t let winning trades become lottery tickets.
- If price action at TP1 shows weakness (low volume on retest, bearish reversal candles), tighten stops or exit fully.
- If the structural support fails mid-trade, take the loss as per your plan — do not widen stops impulsively.
After every trade: log the entry, size, stop, outcome, and a short note about what you learned about liquidity and execution.
Final checklist before putting on the trade
- Confirm price is at or near the $14.4–$14.8 demand zone (or wait for the confirmation breakout per Strategy B).
- Check daily Bollinger Band touch and RSI; look for divergence or initial re-acceleration above 30–40.
- Validate volume on green candles for the rebound attempt.
- Size so that portfolio risk is ≤1–2% and stops sit beyond structural noise (use ATR to quantify).
- Be mindful of macro events (BTC derivatives expiries, major macro prints) that could increase volatility.
Closing thoughts
A disciplined short-swing aiming for $16.50 on LINK is a reasonable, tactical trade when oversold indicators, lower Bollinger Band touches, and extreme fear combine — but it’s not a free option. Structure risk around the $14.4–$14.8 zone is the single biggest invalidation. Use clear stop placement, scaled entries, and conservative sizing. For traders who want to track the broader story while executing, tools such as Bitlet.app can be useful for managing positions and planning flows, but the edge comes from plan + discipline, not hope.
For ongoing market color and short-term ideas, monitor coverage and technical notes like the price-projection piece on Blockchain.News and the structural analysis in The Currency Analytics write-up: https://thecurrencyanalytics.com/altcoins/chainlink-approaches-critical-zone-as-traders-weigh-possible-rebound-212948.
Trade the plan, not the narrative.