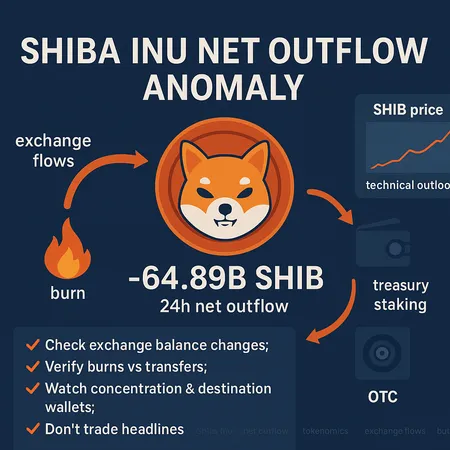
Decoding the -64.89B SHIB Net Outflow: What It Means for Price and Tokenomics
Summary
Why the -64.89B SHIB outflow grabbed headlines
On‑chain trackers reported a -64.89 billion SHIB net outflow in a 24‑hour window, which quickly circulated across social channels and crypto feeds. The raw number is eye‑catching, and some analysts framed it as bullish because fewer tokens sitting on exchanges can reduce immediate sell pressure. For an example of that bullish interpretation see the report noting the -64.89B outflow and its bullish reading (u.today). But other coverage warns this can also precede sharp corrections, so it’s not a single truth to trade off (CryptoNews analysis).
Context matters. This guide breaks down what that net outflow actually signals, how tokenomics and burn mechanics interact with exchange flows, and how retail traders can avoid overreacting to a headline number.
What does “net outflow” mean in practice?
A net outflow over a timeframe equals tokens leaving exchange addresses minus tokens entering them. A negative number (net outflow) means more SHIB left exchanges than arrived. Important nuance: net does not tell you where tokens went — cold wallets, OTC desks, custodial treasury, or burn addresses are all possible destinations.
On its own, net outflow is a directional snapshot of exchange inventory. What matters for price is the destination and intent behind the movement.
Common destinations and their likely market implications
- Burn addresses / dead wallets: True token destruction. Reduces nominal circulating supply; tends to be bullish over time if burns are material and sustained. But a one‑off small burn doesn’t move price much.
- Custodial cold storage / long‑term holders: Tokens moved off exchanges into private wallets usually remove immediate sell pressure — often bullish if accumulation is the motive.
- OTC/whale wallets: Large transfers to OTC counterparties could precede big off‑exchange liquidity events (which can be neutral or bearish depending on whether OTC trades are buys or sells).
- Inter‑exchange routing and smart contracts: Movement between exchange addresses or into complex smart contracts (liquidity pools, staking, bridges) rarely changes sell pressure immediately and can create misleading headlines.
Why a massive net outflow can paradoxically indicate bullish conditions
There are several mechanisms where big outflows reduce market supply and create a bullish backdrop:
- Reduced on‑exchange supply equals lower immediate sell liquidity. Traders can’t sell what isn’t on exchanges, so sustained drops in exchange balances have historically reduced downward pressure for many tokens.
- Burn mechanics and conscious supply removal. If outflows include transfers to burn addresses, they permanently decrease supply. For SHIB, community burns and developer‑led burn initiatives can be constructive for tokenomics when material.
- Treasury or staking moves. Projects or large holders can withdraw tokens to treasuries for buyback/burn programs or to staking contracts that lock supply for a period, which is effectively a temporary supply sink.
- Exchange routing/technical rebalancing. Large operational moves (hot→cold wallets, routing between exchange infrastructure) lower visible exchange balances without representing a sell intent.
The u.today piece argues the -64.89B outflow supports a bullish reading by pointing to lower exchange inventories and potential burns. That interpretation is plausible — but it should be verified by checking where the tokens actually landed.
Why the same outflow can be bearish or ambiguous
Two big pitfalls can flip the narrative:
- Off‑exchange dumping via OTC channels. Big whales can pull tokens off exchange, then sell via OTC or over the counter counterparties in ways that don't show as exchange inflows. That action still exerts selling pressure (just not visible in exchange balances) and can foreshadow price drops.
- Wash routing and internal accounting. Some exchanges or market makers route tokens between addresses for custody or bookkeeping — generating outflows from visible exchange addresses while the tokens remain liquid and sellable behind the scenes.
CryptoNews highlights scenarios where headline outflows preceded deeper corrections for SHIB, underscoring that flow size alone isn’t a dependable buy signal (see the contrasting analysis here: https://cryptonews.com/news/shiba-inu-price-prediction-shib-just-added-another-zero-is-a-bigger-crash-starting-right-now/).
How to read the -64.89B outflow specifically — a practical checklist
Instead of reacting to the headline, run this short forensic checklist:
- Trace the destination addresses. Use Etherscan/Blockchair and check if outflows went to: burn addresses, known custodial cold wallets, OTC addresses, bridges, or other exchanges.
- Check burn transactions. Was a meaningful portion transferred to the zero address or a verified burn portal? Burning is an unambiguous supply sink.
- Look for coordinated transfers. Multiple large transfers to the same non‑exchange wallet suggest accumulation rather than distribution.
- Compare with exchange orderbook and price action. If outflows coincide with rising price and declining sell depth, bullish. If price falls or slumps after outflows, suspect selling pressure elsewhere.
- Watch on‑chain activity metrics. Active addresses, new holders, transfer counts, and whale concentration matter. Sudden spikes in transfer counts can mean distribution rather than accumulation.
- Check timeframes. One‑day outflows are noisy; confirm with 7‑day and 30‑day exchange balance trends.
If many outflows point to burn addresses or long‑term cold storage and orderbooks thin out at the same time, the net effect leans bullish. If outflows go into opaque wallets tied to OTC desks or bridge contracts (which often represent liquidity that can be sold), be cautious.
SHIB tokenomics and burn mechanics in plain terms
Shiba Inu has an elastic psychology more than a precise monetary policy: community burns, merchant burns, and developer initiatives have removed supply episodically. Burn mechanics for SHIB usually involve sending tokens to irrecoverable addresses or using third‑party burn portals and exchanges that support token burns.
Effect on price: burns reduce nominal supply but do not create demand. Price benefits when burns are paired with stable or rising demand; burns alone won’t lift price if buying interest is absent. In a low‑liquidity memecoin, small burns can still have outsized sentiment effects, which can be self‑fulfilling in the short term.
A pragmatic technical outlook framework for SHIB
I won’t give a price target — instead, here are the technical checks that matter after a large flow headline:
- Volume confirmation: Did volume increase on the move? Genuine accumulation or distribution shows in volume and trade skew (buys vs sells).
- Support/resistance and moving averages: See whether price respects prior support bands and key moving averages; sustained closes above major MAs are constructive, breaks below are bearish.
- Relative Strength (RSI/MACD): Watch for divergence — if RSI is rising while exchange balances fall, momentum supports a bullish read.
- Orderbook depth and liquidity pockets: Thinner sell walls can create sharper rallies on positive flows; conversely, large hidden sell walls can cap rallies.
- Correlation with the broader market: Memecoins often follow risk appetite. For many traders, Bitcoin remains the primary market bellwether; if BTC is risk‑on, SHIB flows are more likely to translate into price gains.
AI and model‑based price predictions often highlight this high volatility; recent coverage of machine predictions notes memecoins as speculative alternatives with extreme variance, which reinforces the need for risk controls (see model coverage here: https://cryptonews.com/news/new-chatgpt-predicts-the-price-of-xrp-solana-binance-coin-by-the-end-of-2025/).
Rules for retail traders: separating noise from meaningful on‑chain flows
- Don’t trade the headline alone. Verify destinations, volume, and orderbook confirmation before acting.
- Use multi‑day context. Confirm that 24‑hour outflows fit into a 7‑ or 30‑day trend in exchange balances.
- Size your position and use stops. Memecoins are volatile—manage position size and define exits in advance.
- Prefer staged entries (DCA). If you believe in accumulation, scale in rather than all‑in on a single headline.
- Watch for narrative burns vs. material burns. A PR‑friendly burn that destroys a tiny fraction of supply is sentimentally useful but economically negligible.
- Keep an eye on correlated on‑chain signals. Active addresses, new holder growth, and transfer concentration matter more than raw outflow figures.
- Be skeptical of “exchange balance down = immediate pump” memes. Sometimes exchange balances drop because of internal routing or custodial moves — not because holders are telling the market they’re out.
Tools to use: Etherscan, Whale Alert trackers, exchange reserve dashboards, orderbook snapshots, and on‑chain analytics providers. If you use third‑party services or platforms such as Bitlet.app for trading or settlement, factor in service timing and fees when planning entries and exits.
Bottom line: headlines are a starting point, not a trade plan
A -64.89B SHIB net outflow is a meaningful on‑chain event, but it’s a first clue — not a verdict. Walk the rabbit hole: trace where tokens landed, confirm volume and price behavior, and align the on‑chain read with technical and macro context. When burn mechanics or long‑term custody are the destination, the outflow leans bullish. When tokens flow to opaque wallets tied to OTC activity or bridges, the signal is ambiguous or bearish.
For retail traders, the right approach is methodical: verify, confirm, size, and manage risk. That turns a scary headline into usable information instead of fuel for FOMO.