Solana Tops ETH and TRX in Stablecoin Volume — What It Means for SOL
Summary
Solana’s stablecoin milestone and why it matters
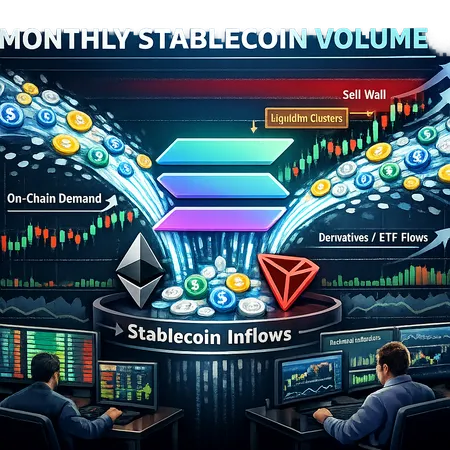
In February 2026 Solana surpassed both Ethereum (ETH) and Tron (TRX) in monthly stablecoin transaction volume, a noteworthy on‑chain milestone that changes how traders and analysts read SOL demand. The report from Crypto.News highlights that this shift is not a tiny blip — it reflects concentrated stablecoin flows moving through Solana’s rails during a period when other chains showed slower stablecoin throughput (Crypto.News).
That metric matters because stablecoin volume is one of the purest short‑term indicators of transaction demand: it captures payments, swaps, stablecoin‑based DeFi activity, and large retail or protocol transfers that require stablecoin rails. For many market participants, on‑chain stablecoin throughput is now as important as exchange orderflow for gauging genuine demand. For comparison, even while Bitcoin retains macro attention, altcoin participants increasingly look to chain‑level money‑movement metrics to time entries in risk assets like SOL.
On‑chain demand vs derivatives and ETF flows: conflicting signals
On‑chain numbers and institutional flow data are telling slightly different stories. The on‑chain case is straightforward: elevated stablecoin activity implies increased retail and protocol demand for Solana tooling and token usage. Yet derivatives and ETF‑adjacent flows are showing mixed confidence. Reporting on derivatives and ETF flow color suggests retail appetite is rising, while institutional allocations remain inconsistent — the net effect is a fragile bid that can be reversed if leverage or institutional selling appears (Invezz).
Mixed tape matters because derivatives amplify any liquidity gaps. If futures open interest and perpetual funding rates spike without corresponding on‑chain accumulation, rallies can be short‑lived as leverage gets unwound. Conversely, sustained on‑chain stablecoin inflows make leveraged squeezes more likely to be effective — but only if the flows persist long enough to absorb liquidity barriers.
Solana’s stronger stablecoin throughput also has DeFi implications: more stablecoins on Solana can mean deeper AMM pools, new lending activity, and higher NFT/market‑making volume. That makes the milestone relevant to DeFi participants as well as spot traders.
SOL technicals: liquidity clusters, sell walls, and a fragile market structure
Technical analysis and on‑chain heatmaps now point to two contrasting realities. On the one hand, the on‑chain demand paints a bullish narrative. On the other, technical studies have flagged downside liquidity clusters and a sell wall that could cap upside without heavy buying pressure.
Recent technical writeups highlight a concentration of resting liquidity and orderbook resistance at specific zones — a classic liquidity cluster where stop orders and limit sells accumulate. Coinpaper’s technical analysis warns that these clusters could signal a possible drop if swept, and that a nearby sell wall may cap SOL’s upside until it is absorbed or displaced (Coinpaper). Another market note underscores fragile market conditions and suggests the broader price action remains corrective rather than decisively bullish (Cryptonomist).
Put simply: the on‑chain demand must overcome structural liquidity obstacles. If incoming stablecoin volume is large and persistent, it can chip away at the sell wall and force re‑pricing. If instead the flows are temporary or concentrated around speculative activity, the sell wall and liquidity clusters create ideal conditions for a liquidity sweep and forced deleveraging.
Actionable trading scenarios if on‑chain volumes persist
Below are pragmatic scenarios for altcoin traders and on‑chain analysts, with setups tied to whether the stablecoin momentum keeps up.
Bull continuation (multi‑day momentum)
- Thesis: Persistent stablecoin inflows sustain rallies and absorb resistance at sell‑wall zones. Institutional flows begin to follow retail demand. This is the highest‑conviction bullish case.
- Setup: Enter on a clean breakout above the sell‑wall zone with volume confirmation (on‑chain stablecoin transfers + rising AMM depth). Use a two‑leg plan: partial entry on breakout, add on pullback to the breakout zone.
- Risk management: Tight initial stop below the breakout point; trail with volatility‑adjusted stops. Time horizon: days to weeks.
Range and accumulation
- Thesis: On‑chain volume remains elevated but not directional; SOL chops between liquidity clusters as buys meet sells.
- Setup: Range trading between the lower liquidity cluster (buy support) and the sell‑wall cap. Favor smaller position sizes and shorter holds. Consider market‑making or delta‑neutral options strategies if available.
- Risk management: Keep stops slightly wider than intraday noise; avoid doubling down into confirmed breakdowns.
Liquidity sweep / corrective drop
- Thesis: The sell wall and liquidity cluster remain intact; until they are cleared, larger players can trigger a liquidity sweep by pushing price below clustered stops, provoking cascading selling.
- Setup: If on‑chain stablecoin flows taper, look for bearish confirmation: rising exchange inflows, spikes in sell‑side limit density, or divergence between rising spot sells and drying futures bids. Short or buy puts around the sweep level with measured size.
- Risk management: Defined risk entries only; place stops above the swept cluster since quick recoveries can occur once liquidity is absorbed.
Volatility arbitrage / event trade
- Thesis: Short bursts of demand produce whipsaws as leverage reacts to on‑chain prints and ETF/derivative headlines.
- Setup: Use smaller, nimble positions or options straddles if implied volatility is cheap relative to realized moves. Trade around scheduled flow windows and protocol events.
- Risk management: Keep exposure low; be ready to exit on large on‑chain changes (big stablecoin transfers, CEX withdrawals).
Note: some outlets suggest SOL may eye levels near $94 under certain flow conditions; incorporate that as a reference zone rather than a guaranteed target (Invezz). Always treat price levels as probabilistic, not binary.
What to monitor in real time
If you trade SOL around these dynamics, track the following indicators closely:
- Solana stablecoin volume (daily and 7‑day rolling) and large stablecoin transfers. Sudden spikes signal durable demand.
- Exchange inflows/outflows of SOL and stablecoins: rising inflows to exchanges can precede selling pressure.
- Futures open interest, funding rates, and ETF/derivatives flows to gauge leverage and institutional posture (Invezz).
- Liquidity cluster heatmaps and limit orderbook depth around identified sell walls — these define the zones to watch for sweeps (Coinpaper).
- Macro breadth across ETH and TRX rails: a rotation back into ETH or TRX could undermine the narrative that Solana alone will catch bid.
Many traders use platforms like Bitlet.app or chain explorers to set alerts for large stablecoin movements and CEX flows; integrating those alerts with orderbook tracking lets you act quickly when a cluster is being tested.
Conclusion — a conditional shift, not a guarantee
Solana overtaking Ethereum and Tron in monthly stablecoin transaction volume is an important structural signal: it shows growing on‑chain demand that could be the foundation for stronger SOL performance. But the market is not binary. Mixed ETF and derivatives flows create conditional outcomes, and technical liquidity clusters plus a sell wall mean that on‑chain momentum must be sustained to translate into a durable rally.
For active traders and on‑chain analysts the path forward is clear: monitor stablecoin throughput and orderbook liquidity in real time, size positions to account for potential liquidity sweeps, and use disciplined stops. If the on‑chain flows persist and institutional desks start to follow, the technical barriers can be consumed — but until then, treat the milestone as a bullish signal with important caveats.
Sources
- https://crypto.news/sol-price-prediction-as-solana-surpasses-ethereum-tron/
- https://coinpaper.com/15264/solana-price-analysis-liquidity-cluster-signals-possible-drop-first?utm_source=snapi
- https://en.cryptonomist.ch/2026/03/09/solana-price-analysis-3/
- https://invezz.com/news/2026/03/09/sol-eyes-94-despite-mixed-etf-derivatives-activity/?utm_source=snapi