Why Bitcoin Failed to Hold $70K — Profit-Taking, Whales, and What Comes Next
Summary
Quick take: what happened
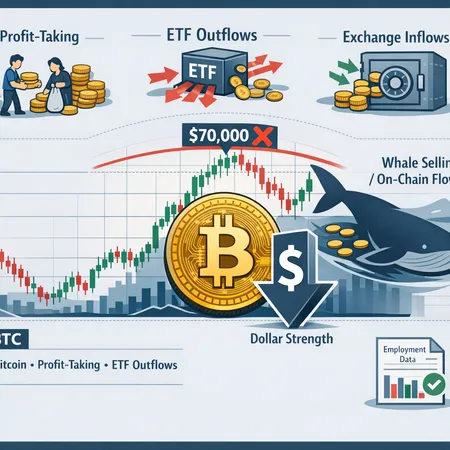
Bitcoin staged a high-profile rebound that skimmed the $70,000 region but failed to hold that level, sliding back toward the high-$60ks into the weekend. The drop wasn’t a single-cause event: on-chain flows show short-term holders and whales taking profits, spot ETFs recorded outflows that reduced marginal bid pressure, and macro forces—most notably a resurgent US dollar tied to recent employment and policy expectations—raised the bar for fresh buyers. For many market participants, Bitcoin still functions as the primary market bellwether, but the dynamics over the past week have highlighted how fragile a move to new highs can be when supply concentrates at the top.
On-chain signals: profit-taking, exchange inflows and whale selling
The most immediate explanation for the failed hold at $70k is distribution: short-term holders moved coins into exchanges to lock gains. On-chain analysis and reporting show increased exchange inflows coinciding with the top of the bounce, consistent with tactical profit-taking rather than long-term, capitulation-style selling. News outlets and on-chain trackers noted that many short-term addresses were transferring BTC to exchanges to realize gains, a classic top-of-rally behavior that saps upward momentum (NewsBTC).
On top of retail and short-holder selling, wallet-level data pointed to larger, more consequential transfers. Santiment-related coverage highlights notable whale selling in the run-up to the rollover, with a cluster of large transfers and concentration changes that align with lower intraday liquidity and accelerated downside moves (Cointelegraph — Santiment data). This kind of whale activity matters because when large holders begin to realize profits, they can overwhelm the remaining bid tail, particularly in thin sessions.
Meanwhile, spot ETF dynamics were not uniformly supportive. After the earlier surge in assets under management, recent sessions recorded outflows from some spot ETF products, eroding a portion of the demand cushion that had helped drive price discovery higher. Those outflows, combined with exchange inflows, create a net supply imbalance that leaves BTC vulnerable to pullbacks even after strong rebounds (Cointribune).
Macro backdrop: dollar strength and employment data
Macro conditions compounded the technical and on-chain pressures. The US dollar staged its steepest weekly gain in about a year, as reported by market outlets, tightening liquidity conditions and raising the effective yield on dollar-denominated cash holdings. A stronger dollar makes dollar-priced risk assets like BTC relatively more expensive for non-dollar buyers and can shift institutional allocation priorities, at least short term (CoinDesk).
Employment and incoming macro surprises—strong payrolls or persistent wage growth—tend to keep policy expectations hawkish. When those data prints push real bond yields higher, they create a headwind for non-yielding assets, including crypto. The confluence of profit-taking and a tightening macro backdrop quickly turns a technical test of $70k into a higher-risk re-entry point for allocators who might otherwise have bought dips.
Why $70k acted like a magnet — and why it failed
The $70k level has acted as a psychological and structural magnet: many SPOT buyers, algorithmic traders and narrative-driven allocators target round numbers for sizing and reflows. CryptoSlate provides useful color on why that magnet keeps pulling price back toward the level during rebounds—the market repeatedly tests that zone as buyers and sellers reprice and re-enter (CryptoSlate).
However, a magnet only attracts when there’s conviction on both sides. This time sellers had reasons to distribute: realized gains for short-term holders, profit-taking by whales, and less reliable ETF bid due to outflows. Combined with a stronger dollar, the buying side failed to show sufficient resilience, so price briefly touched $70k but couldn’t sustain it.
Trading scenarios: the next 30–90 days
Below are three pragmatic scenarios with likely triggers, rough probabilities, and practical trading implications.
Bull case (20–30% probability)
- What happens: ETF bids renew (net inflows resume), retail re-entry picks up on dip-buying, and macro prints moderate—Dollar eases or employment surprises cool. Whales halt distribution and long-duration holders absorb supply.
- Technical result: BTC reclaims $70k, clears resistance above it and extends toward new local highs in a controlled, low-volatility advance.
- Trade/positioning: Add size on confirmation (daily close above $71–72k) with a layered plan: partial adds at defined bands, tight trailing stops, and an allocation cap per portfolio rules. Use options to synthetically monetize convexity (bull call spreads) rather than outright naked leverage.
Neutral / Range-bound (40–50% probability)
- What happens: Selling pressure subsides but demand remains hesitant; BTC trades between roughly $63–72k as buyers and sellers rebalance. Whales may shift to lower-volume accumulation, but ETF flows remain mixed.
- Technical result: Choppy price action with multiple tests of both supports and resistance; false breakouts possible.
- Trade/positioning: Favor mean-reversion and range strategies—shorting strength near resistance with tight stops, buying defined dips into the mid-range, and using calendar spreads to collect theta. Reduce directional exposure and emphasize liquidity and execution quality (staggered entries, limit orders).
Bear case (25–35% probability)
- What happens: Continued whale selling, sustained ETF outflows, and further dollar strength or hawkish data triggers accelerate liquidation. Exchange inflows rise and short-term holders accelerate exits.
- Technical result: BTC breaks below $60k, tests lower structural supports (e.g., $55–58k), and volatility spikes as stop runs and forced liquidation clusters occur.
- Trade/positioning: Tighten risk limits, reduce levered exposure, and deploy protective hedges (puts or inverse ETFs where available). For portfolio managers, reweight using size-based stop rules, increase cash buffer, and prepare staged re-entry plans at defined lower levels.
Risk-management and practical takeaways for traders and PMs
- Size and scenario planning beat predictions: rather than betting on one outcome, define allocation bands for bull/neutral/bear cases and pre-commit to rebalancing rules if price hits those levels.
- Watch leading on-chain indicators: exchange inflows, net flows to/from spot ETFs, and large transfer clusters are early warnings of distribution. Tools and dashboards that track these flows are essential for execution timing—Bitlet.app and other portfolio tools can help surface those signals without manual parsing.
- Use execution-aware orders: in thin sessions, market orders risk slippage; prefer limit or iceberg orders for large fills and staggered entries to avoid being the marginal buyer.
- Hedging is cheap relative to surprise drawdowns: options or delta-hedged structures can protect tail-risk without capping upside entirely. If you’re uneasy about the $70k region as a re-entry point, hedge the position instead of sitting out entirely.
- Psychological discipline: profit-taking is normal and expected at new highs. Treat realized gains and re-allocation as part of portfolio hygiene rather than headline-driven failure.
Conclusion
The failure to hold $70k was the product of overlapping, explainable dynamics: concentrated profit-taking by short-term holders, visible whale selling, spot ETF outflows that eroded marginal demand, and a macro backdrop featuring a stronger dollar and hawkish data. That constellation suggests the move was more a short-term regime check than an immediate structural collapse. Still, the market has lower tolerance for complacent allocations: absent renewed, consistent ETF and retail bids, price is more likely to trade sideways or test lower supports before a decisive new regime appears.
For intermediate traders and portfolio managers, the path forward is scenario-driven sizing, vigilant on-chain monitoring, and execution discipline—use layered entries, hedges, and pre-defined rebalancing rules rather than relying on binary calls. The next 30–90 days will reveal whether buyers absorb the concentrated supply or whether distribution extends into deeper corrections.
Sources
- Bitcoin momentum stalls after heavy investor profit-taking (CoinTribune)
- Why Bitcoin keeps snapping back to the $70k magnet (CryptoSlate)
- Bitcoin slips below USD68,000 as dollar posts steepest weekly gain in a year (CoinDesk)
- Bitcoin bounce fails — short-term holders take profit (NewsBTC)
- Santiment data shows whale selling and its market impact (Cointelegraph)


