Is a Structural Bitcoin Supply Shock Brewing? Exchange Reserves, ETF Flows, and Custody Trends
Summary
Executive overview
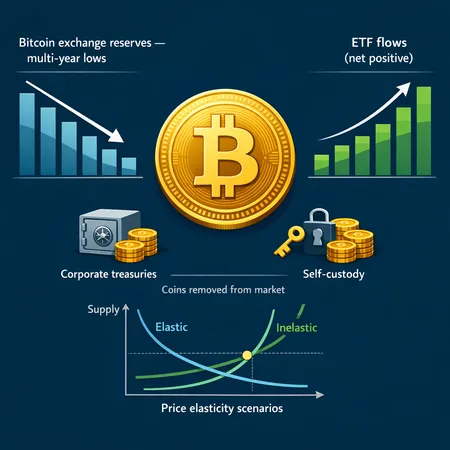
Two datapoints have converged recently: Bitcoin exchange reserves are down to multi‑year lows and spot Bitcoin ETFs have shown renewed positive flows. On the surface, these are clean supply‑side signals: less BTC sitting on exchanges plus fresh institutional demand equals potentially outsized price impact for incremental buys. But the market is more nuanced. This piece dissects why low exchange reserves matter for liquidity and price discovery, reconciles ETF flows with on‑chain custody trends, and maps scenario frameworks to think about BTC price elasticity to new demand.
Why exchange reserves matter for liquidity and price discovery
Centralized exchange reserves — the BTC balances held on exchange hot wallets — function as the marginal supply available to satisfy market orders. When reserves are high, a large market buy can be filled by exchange inventory and limit orders near the top of the book. When reserves are low, the same market buy consumes deeper layers of the order book or forces dealers to source BTC from OTC desks and spot liquidity providers at worse prices.
Mechanically, declining reserves magnify short‑term price impact in three ways:
- Reduced visible depth: fewer limit sell orders close to the mid price means larger slippage for market buys.
- Higher reliance on off‑exchange channels: market makers can only replenish by purchasing on spot venues or from OTC and custodial desks, widening spreads and slowing execution.
- Faster price discovery through on‑chain flows: transfers from cold storage to exchanges (and vice versa) become more determinative of price moves.
Recent reporting confirms reserves are approaching lows not seen since 2019, a noteworthy structural change after years of higher exchange balances. Analysts point to ETF custody and treasury purchases as material reasons some coins never return to exchange inventories once they’ve left. See this analysis documenting the reserve decline and the role ETFs and corporate treasuries in locking supply Blockonomi and an independent confirmation and discussion at Coinpedia.
For institutional allocators, the implication is clear: nominal market depth is lower today than headline circulating supply suggests, and execution budgets need to account for higher marginal impact.
Reconciling ETF flows: back‑to‑back positive weeks and what they mean
Spot ETF flows re‑introduce a regular, on‑ramp demand layer for institutional capital. Recent coverage shows spot Bitcoin ETFs recorded two consecutive weeks of positive flows for the first time in several months — a return of steady near‑term institutional buying momentum (TheCurrencyAnalytics, CoinTribune).
But ETF flows should be viewed through a reconciliation lens:
- ETF net flows ≠ instantaneous spot demand. While ETF inflows typically translate to spot purchases over time (authorized participants minting shares require the ETF manager to source coins), timing is variable: dealers can net flows using existing inventories and cross‑market hedges.
- Spot ETF mechanics can remove supply from exchanges. When ETFs buy spot BTC, that BTC is custody‑controlled and effectively out of the trading float — the same mechanism that contributed to lower exchange reserves.
- Short periods of positive flows can coexist with larger outflows elsewhere. A two‑week positive streak is statistically meaningful but must be contextualized against monthly/quarterly net flows and OTC activity.
The combination of persistent ETF demand and diminishing exchange reserves means that a sizable fraction of institutional buying need not and often does not return to exchange tradeable balances, tightening available market liquidity.
Custody trends: corporate treasuries, self‑custody, and the lock‑up effect
Beyond ETFs, custody trends are a second major supply sink:
- Corporate treasuries (and large strategic holders): when corporations allocate to BTC and place holdings into cold custody, those coins effectively exit the tradable pool. Reporting has highlighted this behavior as a contributor to the multi‑year low in exchange reserves (see Blockonomi coverage).
- Self‑custody and long‑term holders: retail and institutional self‑custody adoption has increased, and long‑term holders show low velocity. When coins move from exchange to cold wallets, they often stay put for extended periods.
- Custodial fragmentation: spot ETFs, qualified custodians, and enterprise wallets distribute supply across silos, complicating rapid redeployment back to exchanges.
This trend alters the elasticity of supply. Where previously exchange inventories could be refilled relatively quickly, the new equilibrium routes replenishment through slower processes: negotiated OTC trades, settlement windows for large institutional blocks, or ETF authorized participant mechanisms.
Platforms and services that help institutions accumulate over time — for example, dollar‑cost averaging or installment purchases offered by apps like Bitlet.app — reduce the need to access exchange liquidity directly, further insulating long‑term demand from intra‑day price dynamics.
Mapping price‑elasticity scenarios for BTC to incremental demand
Price elasticity here means how much the price moves for a given incremental net buy volume. Instead of a single forecast, I offer a three‑scenario framework to guide allocators and strategists.
Scenario A — Baseline (Higher‑than‑historical liquidity but manageable)
Assumptions:
- Exchange reserves remain stable near current multi‑year lows.
- ETF flows are positive but modest and partially offset by miner selling.
- OTC desks and market makers absorb demand without major dislocations.
Result:
- Marginal buys cause more slippage than in peak‑inventory years, but market makers still provide depth. Price is somewhat elastic: 1% of circulating daily volume moves price moderately.
Implication for allocators:
- Use VWAP execution and staggered fills; expect higher implementation shortfall versus prior years.
Scenario B — Structural supply shock (tight float, amplified moves)
Assumptions:
- Exchange reserves decline further as ETFs and treasuries permanently lock up supply.
- Sustained positive ETF flows continue and are joined by corporate accumulation.
- On‑chain flows show net outflows from exchanges with low return velocity.
Result:
- Market depth is thin; small to medium institutional buys (relative to recent liquidity) produce outsized price moves. Price elasticity is low: incremental demand pushes price nonlinearly higher.
Implication for allocators:
- Large allocations will likely need OTC block trades negotiated at a premium or staged over longer horizons. Passive indexing strategies will experience higher tracking error if executed rapidly.
Scenario C — Demand shock reversal or re‑liquidation (temporary dislocation)
Assumptions:
- An exogenous shock (macro risk‑off, rapid rate surprise) prompts sudden selling from levered players or ETF redemptions.
- Exchange reserves briefly swell as custodians or ETFs deposit coin back to exchanges for liquidity needs.
Result:
- Liquidity briefly replenishes, causing rapid repricing downward; shallow order books amplify the fall, then recover.
Implication for allocators:
- Stress‑testing downside is critical. Tactical allocations should include dry powder and contingent liquidity plans.
Practical quant metrics and indicators to watch
For institutional allocators and strategists building operational playbooks, monitor these signals weekly or daily depending on your time horizon:
- Exchange reserves (net outflows to cold storage). A persistent downward trend increases supply tightness risk.
- ETF net flows and AUM changes. Two weeks of positive flows can be early evidence of renewed demand momentum (TheCurrencyAnalytics, CoinTribune).
- On‑chain transfer patterns: sustained movement from exchange wallets to long‑term cold addresses.
- OTC desk spreads and block trade volume: widening spreads and higher OTC premiums indicate stress in spot liquidity.
- Funding rates and derivatives skew: dislocations between spot and futures can signal where demand is concentrated.
Cross‑checking authoritative reporting on reserves and custody flows (e.g., in‑depth pieces that documented the 2019‑level reserve lows) helps ground strategic allocations (Blockonomi, Coinpedia).
Trade implications and execution playbook
- For buy‑and‑hold allocations: prefer staggered accumulation and custody solutions that minimize market footprint. Consider platform tools that enable installment purchases to reduce execution impact.
- For tactical trading: widen stop and limit parameters to account for higher slippage. Use OTC desks for large blocks.
- For risk management: stress test portfolio to scenarios B and C. Simulate concentrated buying needs during low‑reserve regimes and define liquidity thresholds for rebalancing.
Across all strategies, maintain visibility into ETF flows and exchange reserve trends — they are now central to understanding near‑term supply elasticity.
Where this fits in the broader crypto market
For many traders, Bitcoin remains the primary market bellwether; its liquidity profile influences cross‑asset dynamics in DeFi and derivatives markets. A sustained depletion of exchange reserves combined with recurring ETF demand could shift BTC from a relatively liquid macro asset to a higher‑impact, lower‑liquidity allocation class. That changes portfolio construction: position sizes, rebalancing cadence, and hedge decisions must account for the new marginal liquidity regime.
Conclusion
A structural BTC supply shock is not guaranteed, but the convergence of low exchange reserves, renewed positive ETF flows, and increasing custody lock‑ups elevates the probability of a supply‑driven regime change. Institutional allocators should not treat circulating supply alone as a proxy for tradeable liquidity. Instead, incorporate exchange reserves, ETF flow patterns, and custody trends into execution and sizing decisions. Monitor the indicators outlined above and prepare multiple execution pathways — exchange, OTC, and staged accumulation — depending on which scenario unfolds.
Sources
- https://blockonomi.com/btc-exchange-reserves-hit-2019-lows-as-etfs-and-corporate-treasuries-lock-up-supply/
- https://coinpedia.org/price-analysis/bitcoin-exchange-reserves-drop-to-2019-levels-is-a-btc-supply-shock-coming/
- https://thecurrencyanalytics.com/altcoins/bitcoin-etfs-post-first-back-to-back-weekly-gains-since-october-246492
- https://www.cointribune.com/en/spot-bitcoin-etfs-record-two-weeks-of-positive-flows-for-the-first-time-in-five-months/?utm_source=snapi


