Oil Shock vs. Bitcoin: Diagnosing the Messy Correlation and How to Hedge BTC Exposure
Summary
Executive summary
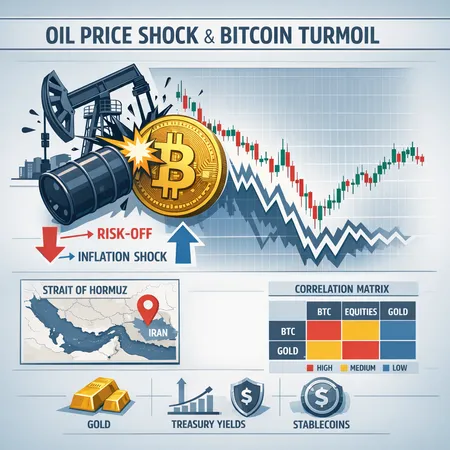
A sudden oil price spike linked to Strait of Hormuz tensions and supply fears forced investors to confront two opposing narratives at once: risk-off (equities and risk assets under pressure) and inflation shock (higher commodity prices raising future inflation expectations). That contradiction is exactly why Bitcoin’s intraday response looked messy — in some sessions BTC sold off with equities, in others it showed resilience as an inflation-protection candidate. This piece unpacks the mechanics, walks through how to quantify short-term correlations to equities and gold, and provides concrete hedging and position-sizing rules for BTC exposure.
What happened to oil — and why it matters for crypto
A fresh surge in oil prices tied to Middle East geopolitics (notably threats to shipping through the Strait of Hormuz and sanctions pressure involving Iran) pushed Brent past critical levels in recent sessions, intensifying market uncertainty and spiking energy-linked inflation expectations. Reporting from Cointribune highlights the immediate pressure on markets as oil neared the $113–114 range, and CoinDesk covered how BTC’s moves split across sessions even as equities fell during the same spike.
Higher oil is a two-headed signal for risk assets:
- Risk-off channel: A geopolitical shock increases perceived tail risk. Credit spreads widen, equities and risky crypto positions can be liquidated, funding costs jump, and leveraged positions (notably in BTC futures and memecoins) are vulnerable to forced deleveraging.
- Inflation channel: Persistent commodity shocks push up inflation expectations, which can renew investor interest in inflation hedges (real assets, commodities, and in some narratives, Bitcoin).
Both channels can operate simultaneously and at different speeds. The immediate microstructure reaction is often risk-off — quick deleveraging and margin calls — while the inflation narrative unfolds over days to weeks as data and central bank guidance evolve.
Why Bitcoin’s reaction was messy: mechanics and market structure
Three practical drivers explain the conflicting intraday BTC responses:
- Leverage and liquidation dynamics: BTC futures and perpetual swaps are highly leveraged. Rapid equity and risk-asset weakness triggers deleveraging across correlated positions; this can push BTC down in the initial hours of a commodity shock.
- Differing investor time horizons: Short-term hedge funds and prop desks respond fast to risk-off, while longer-horizon macro or corporate treasuries may buy BTC as an inflation hedge — producing intraday divergence.
- Funding and basis effects: Futures basis can swing wildly in geopolitical episodes, creating arbitrage flows that either amplify or mute spot moves depending on where liquidity sits.
Coverage after the most recent spike showed this split in plain sight: some outlets recorded BTC rising in certain sessions as traders repositioned for inflation risk, while others noted BTC falling to short-term lows when the immediate risk-off stampede dominated (see CoinDesk and CoinSpeaker for contemporaneous coverage).
Quantifying short-term correlations: a practical approach
Correlation is not a fixed number — it is time-varying and regime-dependent. For portfolio risk management you want rolling, signed measures and lead/lag analysis rather than a single aggregate correlation.
A recommended workflow:
- Use high-frequency or daily returns for short windows (e.g., 1, 3, 7, 21-day rolling windows). Short windows capture immediate regime shifts; longer windows smooth noise.
- Compute rolling Pearson correlation between BTC returns and each bench: S&P 500 (equities), Brent (oil), and Gold (XAU). Also compute cross-correlation with lags to spot lead/lag behavior.
- Complement correlations with conditional measures: rolling beta (OLS of BTC returns on asset returns) and realized volatility ratios.
Observed patterns in recent oil-driven episodes (illustrative ranges based on session-by-session diagnostics):
- BTC vs. S&P500: rolling correlation can jump from ~0.2–0.4 in calm risk-on stretches to 0.6+ during systemic selloffs where deleveraging dominates.
- BTC vs. Gold: short-term correlation is frequently low-to-moderate, often between -0.2 and +0.4; during an inflation narrative it can flip positive as both are bought as stores-of-value.
- BTC vs. Oil: direct correlation is usually weak and unstable — often between -0.2 and +0.3 on short windows — because oil primarily signals macro regime rather than a direct causal driver for crypto.
Important caveats: the precise numbers vary by period, exchange microstructure and liquidity. Rather than memorizing fixed coefficients, make rolling diagnostics part of your standard risk dashboard.
A quantitative hedge ratio you can compute quickly
If you want to size a hedge mechanically, use the minimum-variance hedge ratio from a simple OLS regression:
Hedge ratio = Cov(Return_BTC, Return_Hedge) / Var(Return_Hedge)
Interpretation: this is the notional of the hedge instrument per unit of BTC exposure that minimizes variance in-sample. Practical steps:
- Estimate using a recent short window (e.g., 21 trading days) if you want tactical protection.
- Recompute daily during volatile episodes.
Example (illustrative): if Cov(BTC, Gold) = 0.0008 and Var(Gold) = 0.0016 (daily return variances), hedge ratio = 0.5. To hedge 1 BTC (notional $40k), you'd buy gold exposure equal to 0.5 * $40k = $20k (via ETF or futures). Adjust for basis, liquidity and transaction costs.
Tactical hedges and execution recommendations
Prioritize liquidity and execution certainty when markets move fast. Here are practical hedges and when to use them:
1) Futures/perpetuals (fast, direct)
- Use futures to short BTC or reduce gross exposure quickly. They offer high liquidity and tight spreads.
- Watch funding rates and basis — futures can deviate from spot in stress. Size hedges conservatively to avoid forced rebalancing losses.
2) Options (tail protection, controlled cost)
- Buying puts (protective puts) is the cleanest downside insurance: limited downside exposure and asymmetric payoff.
- Consider collars (buy put, sell out-of-the-money call) if you want cheaper protection and are willing to cap upside.
- Liquidity in options can be uneven; use standardized exchangetraded options or deep OTC relationships.
3) Correlated diversifiers (secondary hedges)
- Gold or TIPS can provide partial inflation protection without crypto-specific basis risk.
- Commodity or broad commodity ETFs can give direct exposure to energy-driven inflation, but watch for spot-futures structure in commodities.
4) Stablecoin and cash layering
- If you expect a prolonged risk-off, shifting a portion of holdings into high-quality stablecoins or cash equivalents reduces forced-sale risk.
Position-sizing rules for BTC during commodity shocks
A disciplined position sizing regime reduces behavioral mistakes under stress. Consider these rules:
- Risk budget approach: define a maximum portfolio volatility contribution from BTC (e.g., target BTC contribution <= 30% of total portfolio volatility). Adjust notional until the contribution meets the budget.
- Maximum drawdown guardrails: size BTC such that a 1-month historical stress move (e.g., 30% drop) does not breach your fund’s maximum tolerated drawdown.
- Reduce leverage or use dynamic margin targets when the oil-BTC correlation rises in absolute value. If rolling correlation with equities rises above 0.5, cut BTC position by X% (example: 25–50%), depending on risk appetite.
- Use size caps for hedges: avoid over-hedging static exposure to short-lived events; keep tactical hedge duration short (days–weeks) unless macro view changes.
Execution, costs, and monitoring
- Slippage and bid/ask: During oil shocks, spreads widen. Increase slippage assumptions in your models and stagger execution across venues.
- Counterparty risk: Options and OTC trades concentrate counterparty exposures; prefer cleared exchanges for central counterparty protection when possible.
- Marked-to-market and funding: Track futures margin and funding rates; funding volatility can erode hedge returns if you hold positions for weeks.
- Rebalancing: Automate daily rolling-correlation checks and set thresholds that trigger hedge rebalancing to avoid ad hoc discretionary decisions.
A sample tactical playbook for managers
- Day 0 (oil spike observed): run 1/3/7-day rolling correlations with equities, oil, gold. If BTC correlation with equities >0.5, implement 25% tactical reduction in net BTC exposure via futures short.
- Day 1–3: buy puts for downside protection if implied volatility is still elevated but options liquidity allows; otherwise keep futures short and monitor funding.
- Day 4–14: reassess natural buyers (inflation-hedge flows). If the inflation story strengthens and data confirm rising inflation expectations, gradually unwind futures shorts and replace with partial gold/TIPS exposure.
- Post-event: analyze realized P&L vs. hedge cost, update hedge-ratio estimation and volatility assumptions.
Why this matters for crypto portfolio governance
Commodity-driven shocks are regime events. They can temporarily flip correlations, create liquidity squeezes, and expose naive hedges to basis and funding risk. A governance framework that mandates rolling-correlation monitoring, pre-defined trigger thresholds for tactical hedges, and clear execution rules will materially reduce behavioral errors.
Risk teams should integrate these analytics into dashboards that include live funding rates, open interest, and short-term cross-asset correlations, and run stress tests where oil moves by 20–40% instantly.
Conclusion
Oil spikes tied to geopolitical risk create a fractious market dynamic: an immediate risk-off impulse that can drive BTC down, and a slower inflation shock narrative that can lift Bitcoin as part of a broader search for non-sovereign stores of value. The net effect on BTC in any session depends on liquidity, leverage, and investor time horizons — which is why simple pairwise correlations fail when you need them most.
For portfolio managers: adopt rolling diagnostics, compute covariance-based hedge ratios, favor liquid tactical hedges (futures and exchange-listed options), and size positions by risk budget and maximum drawdown limits. A repeatable playbook — not ad hoc intuition — keeps crypto allocations resilient through commodity-driven macro turbulence.
Bitlet.app users and risk teams should consider integrating these monitoring routines into their risk stack and rehearsal scenarios.


