Year-end 2025: Whale Accumulation, ETF Outflows, and What Comes Next for Bitcoin
Summary
Year-end 2025: a snapshot
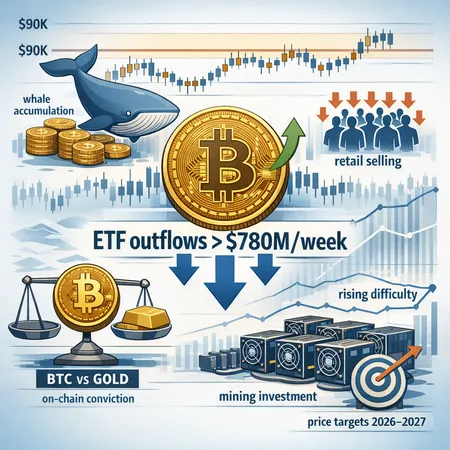
The last weeks of 2025 left crypto markets with a curious mixture of signals: price strength around the $80k–$90k band, clear on-chain evidence of large-address accumulation, and repeated weekly spot ETF outflows exceeding $780m. Those facts coexist, and the job for investors and macro-focused analysts is to read what each signal implies about supply-demand balance and prospective momentum.
For many traders, Bitcoin remains the primary market bellwether. On-chain work published late December highlights that whales — large wallets and institutions — have been the main accumulators in the ~$80k range, a dynamic worth unpacking because it ties conviction, liquidity rotation, and path dependency together. See the on-chain analysis summarized by CoinDesk for the raw accumulation observation: on-chain evidence of whale accumulation.
Whale accumulation: metrics, conviction, and what they signal
When talking about whale accumulation, it helps to separate a few metrics: balance changes of large non-exchange addresses, long-term holder supply changes, and cluster analyses of UTXO age. Late-2025 data shows sustained transfers into large cold wallets and a declining proportion of supply on exchanges — both classic signs that sellers are stepping away and buyers with longer time horizons are taking control.
Why does this matter? Large-address accumulation can indicate conviction rather than short-term trading interest. Whales typically buy in tranches and prefer price levels where they can accumulate without immediate slippage. The $80k–$90k band has become a psychological and liquidity anchor: buyers who step in there often plan to hold through macro noise. That reduces freely floatable supply and can amplify price moves when retail or arbitrage desks become net sellers.
Still, accumulation alone doesn't guarantee an uninterrupted rally. Context matters: how concentrated are the coins, are those holders financed or leveraged, and what are exchange inflows/outflows doing concurrently? Combine the on-chain whale picture with ETF and exchange flow data for a fuller read.
ETF outflows vs price: the flow paradox
At first glance, weekly spot ETF outflows north of $780m look bearish. Institutional products bleeding assets while price rises create a headline contradiction: flows suggest selling, yet spot price strength says otherwise. Crypto.News documented this dynamic late December: weekly spot BTC ETF outflows topping $780m.
There are several ways to reconcile the paradox:
- Different buyer cohorts: ETFs are only one distribution channel. On-chain accumulation by whales and sustained OTC buying can replace ETF demand. Large OTC desks and treasury buyers can buy where ETFs are selling.
- Rebalancing and tax- or profit-taking: ETF outflows can reflect short-term portfolio rebalances or profit-taking rather than a wholesale shift away from BTC exposure.
- Structural shift in custody preferences: some institutions may be moving coins off ETF vehicles into direct custody (or vice versa), which shows up as outflows but not as net liquidation into fiat.
Thus, persistent ETF outflows are a material headwind but not an auto-seal on price. If the on-chain picture shows declining exchange balances, stronger realized accumulation, and growing long-term holder bands, then ETF outflows may be noise in the context of renewed accumulation by other cohorts.
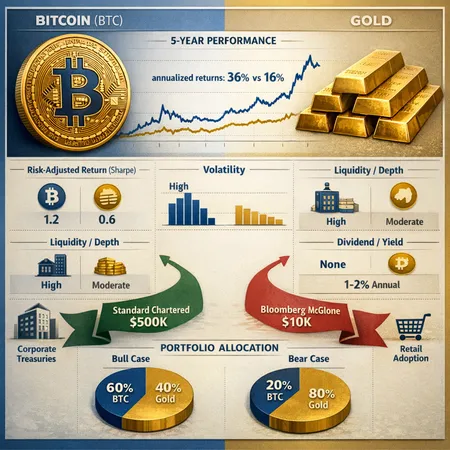
BTC vs gold: narratives, rotation, and macro framing
The broader macro narrative matters because Bitcoin increasingly competes with other store-of-value stories. Coverage of the Bitcoin versus gold debate highlights how commentators frame BTC either as an inflation hedge or as a higher-beta alternative to traditional safe havens. TokenPost recently summarized many of these arguments: Bitcoin versus gold debate and narratives.
Narrative dynamics affect demand composition. In one scenario, macro stress drives flows toward gold and away from risk assets — which would cap BTC upside. In another, persistent disinflation or weak yields push allocators into higher-return stores of value, boosting Bitcoin allocations. The late-2025 accumulation by whales suggests some allocators view BTC as a long-duration asset rather than a short-duration speculative trade.
For portfolio-minded investors, the takeaway is to treat BTC as part of a risk portfolio with asymmetric payoff potential versus gold’s lower volatility but slower compounder profile. That’s why some strategists now model Bitcoin alongside commodities and equities when building forward-looking allocation frameworks for 2026–2027.
Mining difficulty and miner investment: structural bullishness
Miners are price-takers in the short term, but their investment decisions shape Bitcoin’s long-term supply dynamics and network security. The final 2025 difficulty adjustment moved difficulty to ~148.2T — a sign miners are deploying more efficient rigs and expanding hashpower, per CryptoPotato’s reporting: final 2025 mining difficulty increase.
Why is rising difficulty constructive? First, it reflects confidence that mining remains economically viable at current price levels. Second, increased efficiency (new ASICs) lowers the marginal cost curve for continuing operations, reducing the likelihood of mass forced sell-offs from unprofitable miners. Third, higher cumulative hashpower raises network security and the perceived durability of Bitcoin as a store of value.
Miner capex cycles also affect on-chain supply: newly purchased rigs are often financed and can lead to temporary selling as companies raise fiat; but over time, higher hashrate and lower per-unit costs support healthier miner balance sheets and less forced liquidation under stress.
Putting it together: scenarios and price targets for 2026–2027
Rather than a single price call, it’s useful to think in scenarios anchored to on-chain accumulation, flow regimes, and macro conditions.
Conservative base case (range-bound to moderately bullish): Continued whale accumulation plus offsetting ETF outflows leads to a multi-month consolidation and a gradual uptrend. Price targets under this scenario cluster in a higher band relative to 2025 — for planning purposes analysts often model mid-3-digit percents over a year, translating to a range where Bitcoin finishes 2026 materially above 2025 levels but below hyper-bull extremes.
Bull case (re-acceleration): If on-chain accumulation persists, exchange balances continue to fall, and macro flows reallocate from low-yield instruments to BTC, then price momentum could re-enter a breakout phase. Under this scenario, many market commentators sketch 2026–2027 targets that imply a doubling (or more) from late-2025 levels — not impossible given historical cycles and constrained spot supply.
Bear case (flow-driven retracement): Sustained large outflows from ETFs combined with adverse macro shocks or profit-taking by whales could force a re-test of lower support bands. That would purge leveraged positions and could temporarily increase exchange supply.
Putting exact numbers on those scenarios depends on risk tolerance. Rather than promise a single figure, most macro-focused allocators work with a range of price targets and probabilities: a base-case midpoint, a bullish upside multiple, and a drawdown estimate. The critical input from the on-chain picture is that available supply is structurally lower than it was pre-2025 because of accumulation and miner policy changes, which biases the distribution of outcomes higher.
Tactical takeaways for investors and analysts
- Watch large non-exchange address flows weekly. Re-accumulation by whales at the $80k–$90k band is a real-time leading indicator of conviction.
- Treat ETF flows as one part of the mosaic. Outflows above $780m deserve monitoring, but don’t interpret them in isolation from OTC, custody shifts, and on-chain supply dynamics.
- Monitor miner balance sheets and hashprice vs cost curves. Rising difficulty shows miner reinvestment and supports the narrative that supply pressure from miner liquidations is easing.
- Keep macro narratives in view. The BTC vs gold debate frames investor allocations and will influence cross-asset flows in 2026.
For investors who use platforms like Bitlet.app for execution or cross-product strategies, blending on-chain alerts with flow-tracking and macro position sizing can help navigate the asymmetric risk-reward environment ahead.
Sources
- CoinDesk — Bitcoin whales have been the main accumulators in the ~$80,000 range: https://www.coindesk.com/markets/2025/12/29/bitcoin-whales-have-been-the-main-accumulators-in-the-usd80-000-range
- Crypto.News — Bitcoin price eyes symmetrical triangle breakout as weekly ETF outflows top $780m: https://crypto.news/bitcoin-price-eyes-symmetrical-triangle-breakout-as-weekly-etf-outflows-top-780m/
- TokenPost — Coverage of Bitcoin versus gold debate: https://tokenpost.com/news/investing/18137
- CryptoPotato — Bitcoin mining difficulty hits 148.2T in final 2025 adjustment: https://cryptopotato.com/bitcoin-mining-difficulty-hits-148-2t-in-final-2025-adjustment/