Can Treasury and ETF Buying Offset Solana’s On‑Chain Weakness? Tactical SOL Outlook
Summary
Quick thesis
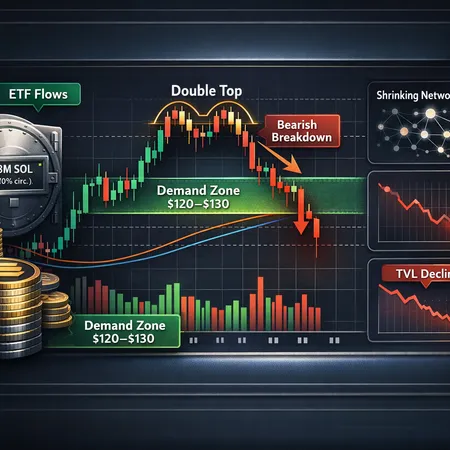
Solana is at an inflection: structurally, large treasury and ETF accumulation has removed a nontrivial chunk of circulating SOL, which can support price by shrinking available liquidity. At the same time, price action has repeatedly reacted to the $120–$130 demand zone and technicals show a double‑top risk that could trigger a deeper corrective move if broken. For intermediate traders and investors positioning into January 2026, the puzzle is balancing scarce float from institutional accumulation against deteriorating on‑chain activity (TVL decline) that undermines conviction for organic rallies.
Recent price action and the $120–$130 demand zone
Price has been negotiating the $120–$130 band as a meaningful demand zone; this area has acted as support during pullbacks and a reference for buyers scaling in. The technical picture that matters right now is the formation of a double‑top around the upper resistance and the tight clustering of lows inside the $120–$130 range. A failed resolve above the top and a decisive break below the demand band would validate the bearish pattern and likely accelerate selling into the next structural support.
Traders should treat this demand zone as a decision point. If SOL holds here on intraday and weekly timeframes with expanding volume, that signals accumulation and an opportunity to scale with defined risk. If the zone fails — especially on rising volume and widening spreads — the double‑top breakdown increases odds of a multi‑week correction. Coingape’s January 2026 technical outlook highlights near‑term demand‑zone considerations that align with this view and maps plausible downside if buyers do not reassert control (see their price discussion for context) — https://coingape.com/markets/solana-price-prediction-how-high-could-sol-go-in-january-2026/.
What the 28M SOL accumulation means: liquidity, narrative, and limits
Recent reporting shows treasury and ETF-related entities have amassed roughly 28 million SOL — about ~5% of the circulating supply — a meaningful chunk that changes supply dynamics. Cryptopolitan’s breakdown of treasury/ETF holdings underlines how institutional accumulation can compress available float and provide technical support during shallow sell-offs: when large holders sit on coins, day‑to‑day liquidity can tighten and price moves become more brittle to order flow (https://www.cryptopolitan.com/solana-treasury-etf-acquired-5-sol-supply/).
But there are important caveats. Concentrated holdings reduce available liquidity but also centralize risk: if funds rebalance, are forced to sell, or if redemptions occur, those concentrated supply pools can become an outsized source of selling pressure. Furthermore, accumulation by treasuries and ETFs supports a narrative for higher prices, but it doesn't automatically translate to continued on‑chain growth or increased developer activity. Narrative and balance‑sheet support matter for price floors; they do less for day‑to‑day organic use‑case adoption unless on‑chain activity follows.
TVL decline and on‑chain activity: why usage still matters
Total value locked (TVL) and related on‑chain metrics (active addresses, fee flow, NFT/DEX volumes) are leading indicators of ecosystem health. Crypto.news highlighted that Solana’s TVL drop — alongside patterns like the double top — increases downside risk because lower TVL often signals fewer transactions, reduced fee revenue, and weaker incentives for validators and app builders (https://crypto.news/solana-price-risks-breakdown-as-double-top-pattern-forms-and-tvl-drops/).
A market supported primarily by balance‑sheet accumulation rather than growing utility can still rally, but such rallies tend to be thinner and more prone to correction when macro liquidity conditions change. In short: treasury accumulation buys time and narrative oxygen; it does not replace genuine product‑market‑fit growth. For a sustainable uptrend, on‑chain activity needs to stabilize or recover — rising TVL, renewed developer deployments, and improving user metrics.
Differentiation from Ethereum: narrative consequences
Perspective matters. Several commentators argue that Ethereum and Solana are evolving into different niches rather than direct competitors — Ethereum as value settlement and security layer, Solana as a high‑throughput application platform with lower fees (see Altcoin Buzz’s discussion) (https://www.altcoinbuzz.io/cryptocurrency-news/dragonfly-sees-ethereum-and-solana-serving-different-purposes/). That bifurcation changes how we read treasury/ETF flows: capital may pour into Solana for yield, speed, or speculative cycles, but those inflows don’t guarantee parity with Ethereum’s composability or developer economics.
For traders, the implication is to avoid binary thinking that treats SOL as interchangeable with ETH. Instead, analyze SOL on its own utility trajectory, and monitor cross‑chain capital flows and narrative rotations that could either amplify or mute the impact of ETF flows.
Actionable scenarios: Bull, Bear, and Neutral
Bull scenario (what must happen)
Price convincingly holds the $120–$130 demand zone and reclaims short‑term resistance with volume expansion. TVL and on‑chain metrics stop falling and begin to stabilize or tick up. Retail and institutional flows continue, and treasuries/ETFs remain net accumulators rather than sellers. Under that path, SOL can resume a measured uptrend toward prior structural resistance levels; Coingape’s near‑term map gives a logical path into early 2026 where technical targets align with renewed demand.
Trade approach: scale into longs with staggered bids inside the demand zone, use tight initial stops below the zone, and add size as on‑chain metrics confirm recovery. Consider selling into discrete resistance bands rather than holding full size through every leg.
Bear scenario (what to watch for)
A confirmed double‑top breakdown below the $120 level on rising volume, together with continued TVL decline and fresh large transfers to exchanges or selling by concentrated holders, would validate a bearish path. In this case, the market could gap down to the next structural support; liquidity vacuums can magnify moves.
Trade approach: short setups on retest of the broken zone, or reduce exposure and hedge with puts or cross‑asset shorts (e.g., size‑appropriate BTC hedges). Keep stop‑loss discipline — if the break is a false move and price reclaims the zone quickly, cut losses.
Neutral / rangebound scenario
SOL chops between roughly $90–$180 as institutional accumulation and sporadic inflows meet macro and utilitarian headwinds. TVL remains depressed but not collapsing. Range traders can work scalps, while longer‑term holders DCA conditionally when on‑chain metrics show stabilization.
Trade approach: keep position sizes small, use defined risk per trade (1–2% of portfolio), and prefer options spreads to limit downside while retaining upside (verticals, calendar spreads).
Practical trade and portfolio rules for intermediate traders
Position sizing: limit any single‑trade exposure to a small percentage of your portfolio (1–3% for levered trades, up to ~5–10% for unlevered core positions) and scale in. Treat concentrated holdings in Illiquid tokens like SOL with extra caution.
Stops and entries: place initial stops below the $120 demand zone for long builds; for shorter timeframes, use tighter stops tied to intraday structure. For shorts, consider waiting for a retest of broken support to improve risk/reward.
Use options and hedges: if available, use put spreads to cap downside cost‑effectively or buy OTM puts as tail protection. Alternatively, small BTC short positions can hedge macro risk if SOL starts to correlate more tightly with Bitcoin during stress.
Monitor on‑chain signals daily/weekly: TVL, active addresses, fee revenue, staking flows, exchange balances, and large wallet movements. A sudden increase in exchange inflows from large addresses is a red flag regardless of apparent ETF accumulation.
Watch institutional flows: follow reporting on treasury and ETF holdings. Accumulation can support price but also concentrates supply; sudden rebalancing events can be violent.
Risk management: use take‑profit tiers and trailing stops. If your position becomes a larger share of net exposure due to appreciation, actively rebalance.
Key watchlist and metrics (what to monitor now)
- Price around $120–$130: support/resistance behavior and volume context.
- Confirmation (or failure) of the double‑top pattern on daily/weekly timeframes. Crypto.news’s analysis is useful background on how that pattern increases downside risk (https://crypto.news/solana-price-risks-breakdown-as-double-top-pattern-forms-and-tvl-drops/).
- Treasury/ETF flow updates and custody reports — follow changes to the ~28M SOL pool (see Cryptopolitan) (https://www.cryptopolitan.com/solana-treasury-etf-acquired-5-sol-supply/).
- TVL and developer activity: whether TVL decline stabilizes or resumes. On‑chain recovery is the most reliable path to a sustainable bull case.
- Cross‑market liquidity: macro sentiment, BTC direction, and stablecoin flows.
Practical example trade (concrete setup)
- Setup: If price revisits $125 with signs of orderbook support and TVL shows a week of stabilization, place a staggered long: 40% at $125, 30% at $120, 30% at $115 (if you use deeper layering). Set initial stop at $110 (roughly 8–12% below entry band depending on exact fills).
- Targeting: take partial profits at $160 and $200, trail the rest with a 15% trailing stop. If TVL and active‑user metrics confirm growth, consider holding a small core position for a longer horizon; otherwise, re‑evaluate at each profit tier.
Final take — balancing scarcity and utility
Large treasury and ETF accumulation materially change Solana’s liquidity profile and supply dynamics; the roughly 28M SOL in institutional coffers provides an important technical backstop and a powerful narrative. At the same time, falling TVL and a visible double‑top pattern create a tangible risk that cannot be offset by narrative alone. Traders should treat accumulation as a conditional tailwind — valuable, but not a substitute for real, sustained on‑chain adoption.
Hybrid approaches — small core positions sized for longer‑term conviction plus tactical, risk‑managed trades around the $120–$130 demand zone — make sense for intermediate traders who want exposure without over‑reliance on a single thesis. Keep on‑chain metrics central to your checklist and respect structure: if the demand zone breaks on convincing volume, reduce directional risk and pivot to defense.
For execution and DCA mechanics, services like Bitlet.app can be useful for managing installment buys or P2P trades, but always match execution tools to your risk plan.
Sources
- https://coingape.com/markets/solana-price-prediction-how-high-could-sol-go-in-january-2026/
- https://www.cryptopolitan.com/solana-treasury-etf-acquired-5-sol-supply/
- https://crypto.news/solana-price-risks-breakdown-as-double-top-pattern-forms-and-tvl-drops/
- https://www.altcoinbuzz.io/cryptocurrency-news/dragonfly-sees-ethereum-and-solana-serving-different-purposes/