Why XRP Keeps Crashing Despite ETF Euphoria: On-Chain, Technicals & Liquidity Roadmap
Summary
Quick take: headlines vs. plumbing
Positive macro or sector headlines — like ETF approvals — often grab headlines, but markets move on cash, chains, and liquidity. For XRP the recent pattern is painfully familiar: public optimism coincides with persistent selling on-chain and weak market structure that can turn a rally into a trap. This analysis stitches together on-chain signals, ETF-flow mechanics, weekly technicals, and liquidity dynamics to produce a practical roadmap for traders and holders over the next 3–6 months.
On-chain outflows and sustained selling pressure
On-chain analytics have been central to explaining why XRP hasn’t held gains. Data providers and analysts point to steady outflows from large custodial addresses and exchanges — a pattern consistent with distribution rather than organic accumulation. For example, CryptoQuant-linked reporting ties ETF-related flows and headlines to escalated selling pressure, suggesting that approvals or ETF chatter can catalyze large, mechanical reallocations that dump XRP into the market rather than creating new net demand (NewsBTC/CryptoQuant analysis).
Two mechanics matter here:
- Concentrated outflows. A small number of wallets or custodians moving sizeable balances into exchanges creates immediate sell pressure that overwhelms retail bids. These flows show up as spikes in exchange inflows and sustained downward pressure on price.
- Rebalancing and profit-taking. ETF-driven allocations often cause portfolio managers to rebalance risk budgets; if XRP is used tactically (or held as collateral), managers may liquidate after headline events to lock gains and normalize exposures.
That combination — large, repeatable outflows plus profit-taking — explains why sometimes good macro news fails to translate into sustained price gains.
How the ETF narrative amplifies flows (and risk)
ETF approval is a powerful narrative: it signals easier institutional access, may unlock new capital, and creates FOMO. But narratives are two-edged. Approvals can also create momentary liquidity vacuums and trigger algorithmic reallocations: funds sell what they can to pay for new ETF buys, or arbitrage desks pare positions to hedge ETF issuance. In short, ETF headlines can concentrate both buying and selling into short windows.
Think of it as plumbing: the headline turns on a faucet (demand), but if the drain (selling) is wider or faster, the water level still drops. That’s why some traders see immediate volatility around ETF events rather than a clean, monotonic appreciation. For many market participants, Bitcoin and its ETF rollout offered a preview: surges of interest were accompanied by heavy intraday rotations and occasional profit-taking that dented follow-through.
Technical structure: the weekly bearish case
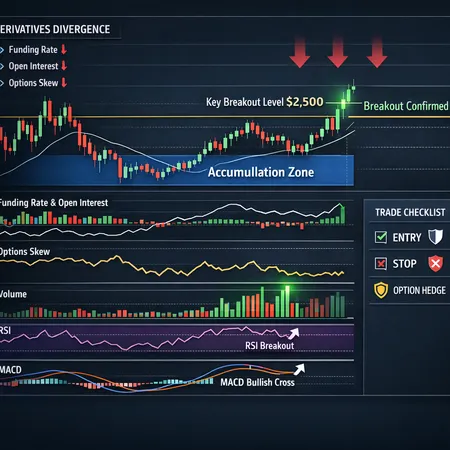
Weekly technicals show an asymmetric risk profile. Veteran chartist Peter Brandt has publicly outlined a bearish weekly structure for XRP, arguing that the macro pattern and price swings support a downside bias on the higher timeframe (NewsBTC — Brandt analysis). A few technical points to note:
- Failure to reclaim and hold a clearly defined higher-timeframe resistance (near prior horizontal zones) converts rallies into supply tests rather than breakouts.
- Weekly momentum indicators (e.g., RSI, MACD) that roll over on high timeframe charts carry more weight than intraday bounces; Brandt’s weekly framing suggests that sellers still control the narrative.
- Measured-move techniques: extended correction patterns and failed bullish attempts increase the statistical chance of deeper retracements.
Put simply: until weekly structure flips in favor of buyers (clean retests and hold of higher pivots on strong volume), the path of least resistance leans lower.
Liquidity, volume dynamics, and the $2 / $1 pivots
Volume is the oxygen of moves. Recent intraday rebounds in XRP have sometimes come with thinning volume — an indicator that rallies lack conviction. For example, an intraday pop that saw a 42% drop in volume raised concerns that follow-through would be weak and short-lived (U.Today report).
Why $2 matters
- Psychological pivot. $2 is a readable round number where stop clusters and limit orders concentrate; it becomes a short-term magnet for both bulls and bears.
- Liquidity shelf. If bids are thin above $2, even modest sells can push price through it quickly, producing fakeouts and catching momentum buyers.
Why $1 is a realistic downside test
- Structural support and order flow. Historical range, measured corrections, and warnings from market commentators have highlighted that sub-$1 levels act as deeper support in many scenarios. Analysts have explicitly warned of the potential for revisits to low-dollar support zones (Finbold analysis warning of deeper collapse toward $0.79).
- Liquidity gaps. If major bids between $1–$2 are thin, a cascade of stop-losses and margin liquidations could push XRP toward stronger base levels near or under $1.
Combine the technical weekly downside bias, persistent exchange inflows, and low-volume rallies and the probability of a test of sub-$1 support over a stressed 3–6 month window is non-negligible.
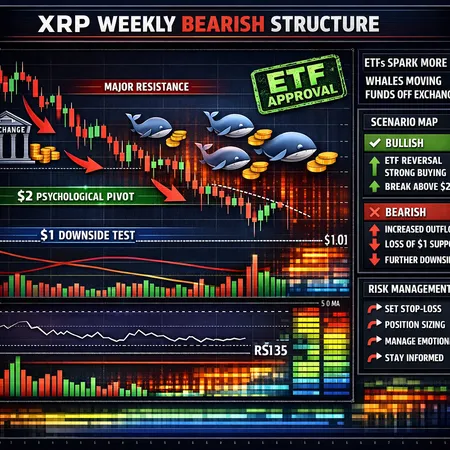
Scenario map: probabilities and tradeable paths (3–6 months)
Below are three pragmatic scenarios with conditional triggers and possible trade actions. Assign your own probabilities based on position size and time horizon.
- Bullish breakout (low-to-moderate probability: 15–25%)
- Trigger: sustained weekly close above the $2 zone on expanding volume and falling exchange inflows.
- Implication: momentum traders can scale in, target measured upside toward higher resistances, and use trailing stops below new support.
- Risk control: keep position sizes limited; consider options to define risk.
- Base-build / range carve (base case: 40–50%)
- Trigger: repeated failed breakouts that establish a defined $1–$2 trading range with tightening volatility.
- Implication: range traders can buy near lower band and sell near upper band; long-term holders should use dollar-cost averaging with a plan to add on confirmed accumulation signals.
- Risk control: set staggered buy orders and tight stop-losses if range breaks down.
- Deeper correction / revisit to sub-$1 (material risk: 25–40%)
- Trigger: renewed exchange inflows, weak macro liquidity, and bearish weekly closes; confirmation via on-chain spikes in outflows and low bid-side liquidity.
- Implication: reduce spot exposure, use hedges (inverse ETFs, short futures, put options), and avoid averaging into large positions absent a confirmed base.
- Risk control: predefine maximum drawdown you’ll tolerate (e.g., 20–35%) and size positions accordingly.
Practical risk-management and execution checklist
- Quantify exposure: never risk more than an agreed % of portfolio on a single token. For speculative trades, keep size small and clearly defined.
- Use time-based rules: if your thesis hasn’t materialized in 30–90 days, reassess. News-driven rallies often fade quickly.
- Protect with orders: use stop-losses, but place them logically (below weekly support for swing trades, below intraday levels for short-term trades). Avoid emotional tinkering.
- Layer entries and exits: scale into positions in tranches, and scale out on strength to lock profits. If you’re a long-term holder, consider staggered buys below key support zones rather than lump-sum averaging.
- Hedge when appropriate: options or inverse futures can preserve capital during large drawdowns; they carry cost but can prevent forced selling during volatility.
- Watch on-chain flow metrics: exchange inflows, large wallet movements, and custodial transfers are early signals that distribution is happening. Bitlet.app users can monitor order-book dynamics in parallel with chain indicators.
Tactical trade ideas (not financial advice)
- Short-term range trade: sell into rallies near $2 if volume is weak; buy dips toward $1–$1.20 only with strict stops.
- Hedges for holders: buy short-dated puts or sell covered calls to monetize range-bound exposure while protecting downside.
- Event-driven play: if an ETF-related date approaches, reduce position size into the event and re-enter on confirmed structural improvement (decreasing exchange outflows + high weekly close).
What to watch next (key indicators)
- Exchange inflows/outflows and large wallet transfers (CryptoQuant-style metrics).
- Weekly closing price behavior around $2 and the $1 lower boundary.
- Volume profile on breakouts: expanding volume validates moves; shrinking volume warns of traps (see the 42% drop example reported by U.Today).
- Macro liquidity and cross-market flows: risk-on windows can attract fresh liquidity, while risk-off periods amplify sales.
Final thoughts
Headlines like ETF approval are powerful narratives, but they don’t replace the underlying market plumbing. For XRP, repeated on-chain selling, bearish weekly structure, and fragile liquidity combine to produce asymmetric downside risk even amid positive news. Traders should treat rallies as potential supply tests unless confirmed by expanding volume and declining exchange outflows. Long-term holders can still build positions, but they should do so with defined risk controls and readiness to hedge.
Markets are messy; so are narratives. Use both on-chain evidence and traditional technicals to build an evidence-based plan, and update that plan as the plumbing changes.
Sources
- https://www.newsbtc.com/analysis/xrp/why-xrp-price-keeps-crashing/
- https://finbold.com/warning-xrp-under-threat-of-deeper-collapse-to-0-79-support/?utm_source=snapi
- https://www.newsbtc.com/analysis/xrp/a-bearish-xrp-price-chart/
- https://u.today/xrp-to-2-but-42-volume-drop-threatens-next-move?utm_source=snapi