Scrutinizing the $1,100 BNB Breakout Call: Technical Proof, Liquidity Reality, and Risk Controls
Summary
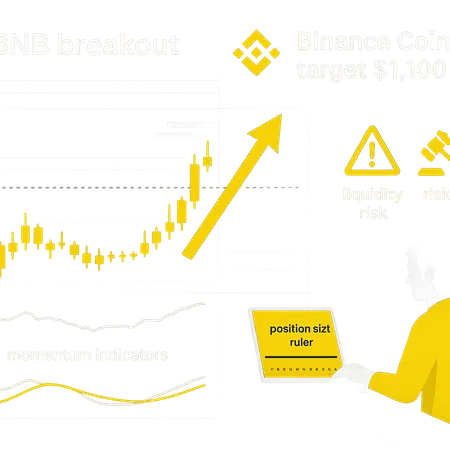
Why this $1,100 call matters — and why we should examine it closely
A high-profile forecast has put a bold number on the table: a Binance Coin target of $1,100 after the token broke out of a multi-year range. That kind of BNB breakout narrative grabs headlines and flows into trader FOMO. Before adding exposure, technical traders and swing investors need to parse price action, confirm momentum indicators, and weigh the real-world liquidity and regulatory risks that can turn a textbook breakout into a failed rally. For context on how the market interprets exchange-driven moves, see reporting on Binance’s liquidity footprint and trading influence here. A separate piece lays out the bullish $1,100 projection tied to the recent breakout here.
Technical picture: what the breakout actually tells us
The price clearing a four-year consolidation is a meaningful structural event: long bases remove overhead supply and give bulls a clear reference — the prior range high becomes a first support. In technical terms, the breakout accomplishes three things: it shifts the market from mean-reversion to trend-following for many participants, it compresses risk (clearer stop placements), and it provides a framework for measured targets.
Measured-move math and multi-timeframe confirmation. A common approach is to project the range height from the breakout point as a conservative first target. That gives traders a logical short-to-medium-term objective and an initial place to take profit. A parabolic leap to $1,100 in 3–4 weeks implies not just a breakout but sustained, accelerating momentum across daily and intraday timeframes — something you should verify with momentum indicators rather than hope for.
Volume and participation. Confirming the breakout requires above-average volume on the move, ideally accompanied by rising on-balance metrics (OBV) or accumulation on higher timeframes. Low-volume breakouts are frequently false; high volume on Binance order books (discussed below) lends credibility.
Momentum indicators to watch
- RSI: Look for a stable rise above 60–70 on the daily chart. Overbought conditions can persist, but an RSI that spikes then quickly rolls over suggests exhaustion. Watch for bearish divergence (price makes higher highs while RSI does not).
- MACD: A widening MACD histogram and bullish MACD line crossover on the daily/4H support continuation. Beware a rapid collapse of the histogram — it often prefaces sharp pullbacks.
- Volume-weighted indicators: VWAP or 20–50 EMA confluence on pullbacks often marks institutional buying zones for trend-followers.
Momentum confirmation across multiple timeframes (daily plus 4H or 1H) reduces the odds of being trapped in a retest. But indicators are lagging; they tell you what happened more than why it happened.
Liquidity, order books, and the Binance effect
Binance’s market share matters. Exchange concentration alters how price moves; with heavy liquidity on Binance, large aggressive buys can push price faster than on thinner venues. Reporting on Binance’s dominant trading footprint explains why exchange-driven flows can become self-reinforcing: when liquidity pools are deep, a coordinated inflow finds counterparties more easily, facilitating sharper moves (see analysis here). For traders, this is a double-edged sword.
Why liquidity can both fuel and limit parabolic runs:
- Fuel: Deep order books and high taker liquidity let momentum trades execute large size with limited slippage, amplifying upward velocity.
- Limit: Concentrated liquidity also concentrates risk — a handful of large sellers or internal balancing operations can create abrupt resistance. Moreover, if meaningful liquidity lives off-exchange in OTC or custody, on-book depth may be illusionary at extreme prices.
Watch real-time depth and spread. During sharp rallies, the order-book spread often widens and visible depth thins at higher price levels. That creates a ladder effect where market buys leap through layers of liquidity; the faster that happens, the more likely a volatile retracement when buyers pause.
Fundamental catalysts that could sustain a near-term parabolic move
- Tokenomics: BNB’s quarterly burns and ecosystem demand (trading fee discounts, chain activity) create a structural supply sink that supports longer-term appreciation.
- Network growth: Rising active addresses, DApp activity, or DeFi inflows on BNB Chain can provide durable demand.
- Macro and cross-market flow: A bullish Bitcoin impulse often drags altcoins along. For many traders, Bitcoin remains the primary market bellwether; if BTC inks a rapid leg up, capital can cascade into BNB.
- Exchange-driven flows: With Binance’s trading dominance, large trading initiatives or listings can produce outsized liquidity surges that accelerate moves.
Key invalidation risks (what can stop the $1,100 story fast)
- Regulatory action or delisting risk: Any credible rumor or action threatening exchange listings or BNB’s utility can trigger immediate outflows. Regulatory headlines move markets faster than technical setups.
- Market depth fragility: If much of the available buy liquidity is near-term taker interest rather than deep limit orders, a single large sell block can erase several hundred dollars of gains in hours.
- Leverage and liquidations: Parabolic rallies attract levered longs; cascading liquidations on a retracement magnify volatility in both directions.
- Macro liquidity tightening or a sudden BTC reversal: Altcoins typically lag and then exaggerate BTC weakness.
Practical guidance: position sizing, stop placement, and trade planning
Chasing a breakout without rules invites quick losses. Below are pragmatic, trader-focused controls for those considering adding BNB exposure during this impulse.
Position sizing:
- Risk-per-trade rule: Limit initial risk to 1–3% of account capital for directional swing trades. If your account can tolerate bigger swings and your conviction is high, scale exposure gradually rather than deploying full size at once.
- Scale-in approach: Consider buying a partial allocation at the breakout and adding on disciplined pullbacks or confirmed continuation signals (e.g., retest holds above breakout level on 4H).
Stop placement methods:
- Technical stop (range-based): Place stops below the breakout retest or below the nearest structural support (for example, the prior consolidation high) — a stop that reflects a logical invalidation point.
- Volatility stop (ATR-based): Use 1.5–3x ATR on the timeframe you trade. ATR-adaptive stops respect current market noise and reduce being taken out prematurely in choppy moves.
- Time-based checks: For swing traders, if price fails to make progress toward your intermediate target within a predefined time (e.g., 2–3 weeks), reduce exposure.
Take-profit and risk management:
- Tiered exits: Scale out at predefined target levels (measured-move target, then psychological round numbers). Lock profits if price hits first milestones, and move stops to breakeven accordingly.
- Trailing stops: For trend-followers, use a channel-based trailing stop (e.g., 20 EMA on daily or a 3–5 ATR trailing) to remain in winners while capturing parabolic upside.
Leverage and derivatives caution: Using margin or perpetual contracts to chase a short-term parabolic move greatly increases liquidation risk. If you trade derivatives, size positions so that a single retracement won’t force liquidation — keep leverage low (e.g., under 3–5x for volatile assets) and maintain a clear exit plan.
A practical checklist before entering
- Confirm the breakout on volume and 2 timeframes (daily + 4H).
- Check order-book depth on Binance and at least one other major exchange for symmetry.
- Define downside invalidation (where you’ll stop out) and risk % up front.
- Decide scale-in points and profit-taking zones; don’t plan to hold a single, undiversified all-in trade.
- Monitor headlines for regulatory or exchange-specific developments; institutional flows can flip the setup quickly.
Bottom line: possible, plausible, or improbable?
A move to $1,100 within 3–4 weeks is possible under a runaway liquidity wave, aggressive on-exchange buying, and favorable macro backdrop. That said, it’s a low-probability event versus a more measured multi-month or year target implied by traditional measured moves and tokenomics — the sort of timeline cited by longer-term forecasts. The recent breakout is technically bullish and meaningful, but momentum indicators, real-time Binance order-book depth, and event risk will decide whether this is the start of a durable trend or a short-lived parabolic impulse. Traders should guard against FOMO, use disciplined position sizing, employ ATR- or structure-based stops, and watch the liquidity landscape closely.
For those building plans around this breakout, Bitlet.app’s tools can help manage installment and position sizing strategies while you monitor order-book flow and headlines.