Diagnosing Extreme Fear: A Systematic Framework to Find a Durable Crypto Bottom
Summary
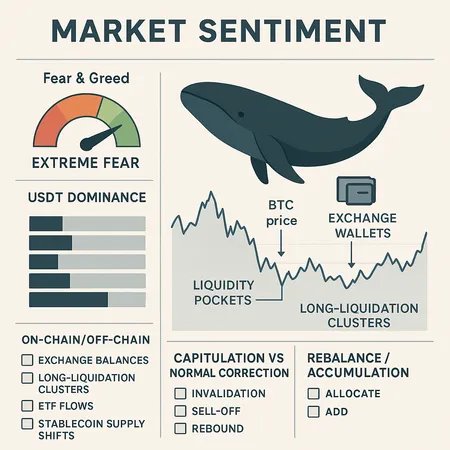
Why extreme Fear & Greed readings need context
The crypto Fear & Greed index is a useful barometer: when it sits in the extreme fear zone, headlines multiply and short-term volatility typically increases. But sentiment alone doesn't tell you whether prices are near a durable bottom. To move from reactionary trading to systematic decision-making you must combine that sentiment signal with flow data — who is selling, who still has dry powder, and where liquidity is concentrated or absent.
This article synthesizes three complementary lenses: whale selling behavior, institutional/retail sell-side patterns (as highlighted in recent industry research), and stablecoin/Tether (USDT) dominance as a proxy for buyer liquidity. It then lays out the on-chain and off-chain indicators portfolio managers should monitor and offers a practical checklist for rebalancing or opportunistic accumulation. If you use tools like Bitlet.app, these frameworks can help you operationalize rules rather than rely on emotion.
Mapping sellers, buyers, and illiquid pockets
Understanding the market requires a map — not just price action. Think in three buckets:
- Sellers: entities actively reducing risk (exchange inflows from large wallets, marked OTC flows, institutional ETF redemptions). These create immediate selling pressure.
- Buyers/dry powder: newly minted stablecoins (USDT), inflows to exchanges on the buyer side, fiat-to-crypto rails used by market makers and institutions. These supply potential demand to meet sellers.
- Illiquid pockets: long-term cold wallets, staking contracts, and vaults where supply is effectively removed from the float.
Whale selling signals
Whale selling shows up as large transfers to exchanges, repeated on-chain swaps that then route to known centralized-operator addresses, or concentrated long-term holders moving balances. Key behaviors to watch:
- Sustained large transfers to exchange hot wallets across multiple days (suggests selling rather than simple rebalancing).
- On-chain clusters where historically dormant wallets wake up and move large BTC positions — often a late-cycle sign.
- Short-term spikes in supply on exchanges coupled with rising realized loss metrics (indicating coins that are underwater being sold).
Whale selling can accelerate a drawdown, but it’s not always capitulation: sometimes large holders rebalance into fiat or move positions into OTC desks without immediate market dumps.
Tether (USDT) and stablecoin dominance as buyer proxy
USDT and other major stablecoins are the primary conveyor of on-demand crypto buying power. Two useful signals:
- Net stablecoin issuance: a sustained rise in USDT supply not matched by redemptions often precedes new buying waves (fresh capital entering crypto). Conversely, stagnant or falling USDT supply can signal weak marginal demand.
- Stablecoin distribution: large USDT deposits to exchanges increase immediate buying capacity; minting that routes to custodial or on-exchange addresses is especially actionable.
Mapping USDT flows against exchange balances gives a clearer picture: if whales are pushing BTC to exchanges but USDT inflows are absent, the order book imbalance favors further downside.
Key indicators to monitor (on-chain and off-chain)
Here are pragmatic indicators to track daily/weekly. Each one has a directional interpretation and suggested trigger levels you can tune to your mandate.
On-chain indicators
- Exchange balances (BTC on exchanges): rising balances = higher sell pressure potential; falling balances = potential shortage of available liquid BTC. Watch for sustained trends rather than single-day moves.
- Long-liquidation clusters / derivatives open interest: high open interest combined with stretched positions (extreme long exposure) makes sharp liquidations likelier on a shock. Large long-liquidation events often mark local capitulation.
- Large transfer-to-exchange events (whale inflows): spike frequency and aggregate size — multiple large inflows in a short window are a red flag.
- Realized losses and spent output age bands: increasing realized losses and older coin movement into spent outputs indicate capitulation among long-term holders.
- Stablecoin supply shifts (USDT minting/redemption): net minting delivered to exchange addresses suggests buyer capacity.
Off-chain / market-structure indicators
- ETF flows and institutional flow reports: net outflows from spot or derivative products are immediate sell-side pressure; persistent outflows from ETF-like vehicles are more structural.
- Exchange order-book depth and spreads: thin books at lower prices imply higher slippage for buyers and lower support.
- OTC desk activity and quoted spreads: if desks report heavier selling than buying or widen OTC spreads, expect larger price impact for any forced buying.
- Macroeconomic signals and rates: sharp, risk-off moves in rates or FX can remove cross-border liquidity and tighten funding costs.
Distinguishing capitulation from normal correction — a framework
Capitulation is often described emotionally, but it has measurable fingerprints. Use a composite view rather than a single metric.
- Breadth and breadth deterioration
- Normal correction: concentrated into speculative altcoins, while BTC and majors show relative strength.
- Capitulation: broad-based breakdown across BTC, major L1s, and top DeFi tokens with synchronized volume spikes.
- Liquidity gap vs. temporary selling
- Normal correction: selling is absorbed as liquidity replenishes (stablecoin inflows, market makers step in). Order book depth restores within days.
- Capitulation: exchange balances surge, order book depth thins, and there’s a lack of stablecoin inflows to meet sellers.
- Realized loss and holder behavior
- Normal: selling largely from short-term traders; long-term holder metrics remain intact.
- Capitulation: long-dormant wallets move coins into exchanges and realize losses at scale. Realized losses spike and stay elevated.
- Derivative cascade risk
- Normal: manageable liquidations, skew in futures normalized in 24–72 hours.
- Capitulation: large, persistent liquidation clusters that force deleveraging across markets (BTC, derivatives basis collapses).
- Institutional windows
- Normal: ETF flows and institutional behavior may ebb but don’t flip to sustained redemptions.
- Capitulation: persistent institutional outflows, widening spreads on prime services, and KYC/fiat rails showing friction.
When three or more of these conditions coincide, the probability of true capitulation — and therefore a potential durable low — increases.
Practical checklist for portfolio managers and long-term holders
This checklist converts the framework into repeatable rules. Tailor sizing and thresholds to your mandate and liquidity tolerance.
- Predefined sizing buckets: define Accumulation Buckets A (opportunistic, 2–3% new allocation), B (opportunistic, 4–8%), C (rotation/rebalancing, 10–20%). Use time-weighted entries across each bucket (e.g., 4–6 tranches) rather than lump sums.
- Liquidity buffer: maintain a cash/stablecoin buffer equal to expected drawdown capacity (e.g., 3–6 months of operating needs + dry powder for opportunistic buys).
- Trigger matrix (example):
- Soft signal (start scaling in): Fear & Greed extreme + net stablecoin issuance rising or stablecoin inflows to exchanges > X% week-on-week.
- Intermediate signal (add): Exchange BTC balances plateauing or declining after peak, realized losses peaking, and whale inflows subsiding for 48–72 hours.
- Hard signal (aggressive add): Realized losses spike, whales stop net inflows to exchanges, USDT supply mints route to exchanges, and derivatives open interest falls sharply (deleverage complete).
- Rebalancing rule: avoid forced selling at sentiment extremes; rebalance only when allocation deviates by predefined bands (e.g., >5% absolute drift) unless systemic risk indicators are triggered.
- Stop-loss vs. mental stop: prefer staggered rebalancing rules and position sizing rather than tight stop-losses during extreme fear, which can force exits into illiquidity.
- Execution guidelines: use limit orders layered across, target OTC execution for large blocks to minimize market impact, and prefer DCA for re-entry unless technical liquidity confirms depth.
Signals that suggest it’s not the bottom
- Fear & Greed dips without a corresponding rise in stablecoin inflows or a stabilization of exchange balances.
- Continued heavy whale-to-exchange flows without substantial buying from on-exchange USDT or fiat rails.
- ETF/institutional flows turning persistently negative with no signs of macro relief or liquidity restoration.
Example application (decision tree in words)
- Step 1: Observe Fear & Greed in extreme fear. Flag the market for extra monitoring.
- Step 2: Check USDT supply and distribution. If new minting routes to exchanges, probability of absorbable selling rises — start scaling in small tranches. If USDT supply is flat or contracting, raise caution.
- Step 3: Monitor exchange BTC balances and whale inflows. If balances keep rising and whales keep sending to exchanges, delay larger allocations.
- Step 4: Confirm derivative deleveraging and realized-loss peak. If long-liquidation clusters unwind and open interest falls, consider moving from bucket A to B.
Closing thoughts: a probabilistic posture, not a prophecy
Extreme sentiment readings create opportunity, but they’re not proof of a durable bottom by themselves. The durable bottom emerges when selling pressure exhausts, liquidity-side buyers (often signaled by stablecoin flows) appear, and on-chain indicators show that long-term holders are not capitulating en masse.
Use this framework to turn fear into a disciplined playbook: monitor exchange balances, whale flows, long-liquidation clusters, ETF and institutional flows, and USDT movement. Apply staged entries, maintain liquidity buffers, and prioritize execution that minimizes market impact. For portfolio managers and long-term holders, the goal is not to catch the exact nadir but to build a repeatable process that captures the bulk of the upside when markets recover.
For further reading on the mechanics behind these indicators, explore research on on-chain liquidity dynamics and stablecoin-driven demand in crypto markets, or check related topics such as Bitcoin and MarketSentiment.


