Inside Bitcoin’s Surge to ~$93,000: Venezuela Operation, ETF Inflows and Derivatives Bets
Summary
Executive snapshot
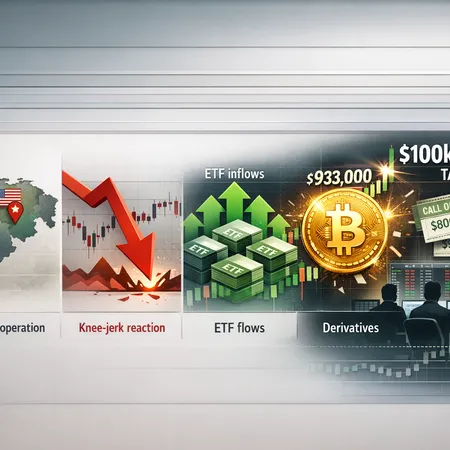
Bitcoin surged toward $93,000 in early January 2026 after a confluence of three forces: a U.S. operation in Venezuela that altered risk pricing, renewed institutional ETF inflows that absorbed available supply, and aggressive derivatives positioning (notably concentrated call buyers betting on a move to $100k). This piece lays out a clear timeline, explains the mechanics behind ETF-amplified rallies, decodes the options activity, frames risk scenarios (bull trap vs continuation) and offers tactical guidance for intermediate traders and institutional allocators.
Timeline: how events unfolded (concise chronology)
1) The geopolitical shock: Venezuela operation
In late December and early January reporting connected a U.S. operation in Venezuela to sudden shifts in energy markets and risk sentiment. Coverage such as the analysis on how oil prices reacted and how that handed Bitcoin a geopolitical bid helps explain the initial market impulse (CryptoSlate). The raid introduced short-term uncertainty across macro assets and pushed some allocators toward perceived hedges.
2) The knee‑jerk market reaction
The geopolitical news produced an immediate knee‑jerk risk repricing: traditional safe-haven flows and tactical rotation were visible across FX, oil and crypto. Crypto reporters broke down why BTC moved on the story and noted that ETF vehicles were already primed to accept new capital as managers reacted to volatility (Crypto.news). The result: a quick, visible bid into spot BTC as traders priced in higher systemic risk.
3) ETF inflows and mechanical amplification
Once institutional ETF flows resumed in material size, the supply-demand equation in spot markets tightened. Major reporting and flow trackers noted renewed inflows across major ETF structures that coincided with the move higher, validating that institutional demand was an active component rather than a passive backdrop.
4) Derivatives positioning and bullish bets
Options and futures desks reacted quickly. By January 5, market intelligence showed traders increasing call exposure and even placing directional bets targeting $100k, signaling that derivatives markets were pricing in a further extension beyond $93k (CoinDesk). However, this same options activity created crowded payoffs that can amplify intraday moves but also reverse violently if delta flows unwind.
Why ETF inflows matter: absorption, scarcity and momentum
Institutional ETF demand changes the microstructure of the spot market in a few repeatable ways:
- ETFs create predictable, recurring buy pressure when flows are positive. Managers convert fiat into BTC to match fund inflows, which requires buying in the spot market or via OTC.
- Large ETF buys tend to be executed through block trades and OTC venues where liquidity is finite; heavy demand can lift price levels quickly as natural sellers get absorbed.
- The mechanical nature of ETFs — predictable purchases on inflows — can bootstrap momentum. As price moves up, momentum traders and trend-following funds pile in, deepening the move.
Put simply: when institutional ETF inflows are sizable and sustained, they can absorb supply and create a feedback loop that makes rallies self-reinforcing for a period. That dynamic was visible during this breakout, when flows and spot buying coincided with headlines.
Decoding the derivatives response: calls, skew and $100k bets
Derivatives markets often move first and fast. Two related patterns stood out during this episode:
Heavy call positioning and positive skew
Options desks reported lopsided call buying: traders bought call spreads and outright calls with strikes above current levels, skewing the market toward a bullish bias. Heavy call demand pushes implied volatility and call skew wider, which changes how market makers hedge — typically by buying spot or futures to be delta-neutral — thereby adding to upward pressure.
Concentrated $100k exposures
Reports indicated specific trader positions and open interest concentrated around $100k strikes and beyond. These are not casual retail bets: they reflect institutional or professional participants allocating gamma and directional risk. The presence of concentrated $100k exposure means two things: first, the market is positioning for continuation; second, if price stalls, hedging flows can reverse quickly as option sellers unwind.
CoinDesk captured how many traders started the year with bets pricing in a rally above $100k, highlighting how derivatives were aligned with the spot breakout (CoinDesk). That alignment amplified upward moves in an already tight market.
Interplay between geopolitics, ETFs and derivatives — why the timing mattered
The Venezuela operation injected an exogenous risk shock. In a market where institutional vehicles (ETFs) were already standing by for fresh cash, the shock acted as a trigger: some allocators rebalanced into BTC as a hedge or diversification play, ETF managers accepted flows, and derivatives desks reacted to price action by hedging with delta buys. The three-layer stack — geopolitical bid, ETF mechanical purchases, derivatives hedging — produced a classic short-squeeze / momentum amplification scenario.
Analysts also raised caution that part of the move was narrative-driven and might lack broader macro support beyond short-term risk repricing (Cointelegraph). That sets up clear risk asymmetries.
Risk scenarios: bull trap vs continuation
Intermediate traders and allocators should weigh two plausible outcomes with probability buckets adjusted to their risk tolerance.
Scenario A — Bull trap (short to medium term)
How it plays out:
- ETF inflows slow or reverse after an initial headline-driven surge.
- Derivatives market hedges unwind as call buyers take profits; delta sells pressure spot.
- Macro headlines cool; liquidity providers step back, producing quick drawdowns.
Why it’s plausible: concentrated positioning around specific strikes and reliance on a short-term geopolitical narrative make a reversal possible. Cointelegraph’s cautionary note about a $93k bull trap highlights this risk.
Tactical indicators to watch for a bull trap:
- Rapid decline in ETF net flows or visible outflows in daily trackers.
- Put/call skew normalizing as calls get sold and implied vols compress.
- Volume drying up on rallies and increasing on down moves (distribution).
Scenario B — Continuation into a macro-driven rally
How it plays out:
- ETF flows persist or grow as institutional participants decide the geopolitical shock justifies longer-term allocation to BTC.
- Derivatives positioning remains net-long, with delta hedging continuing to provide buy-side support.
- Broader macro variables (inflation expectations, risk-on tilt in equities, FX weakness) align to sustain flows.
Why it’s plausible: institutional allocation cycles and the structural scarcity introduced by ETF demand can sustain rally dynamics well beyond the initial narrative trigger.
Tactical indicators to watch for continuation:
- Steady, repeatable ETF inflows over days/weeks.
- Higher open interest in calls with sustained positive gamma and upward skew.
- On-chain indicators showing increasing long-term holder accumulation, not just short-term traders.
Tactical guidance: how traders and allocators should think and act
Below are practical steps tailored to intermediate traders and institutional allocators, balancing upside capture with risk control.
For intermediate traders (time horizon: days–weeks)
- Size exposure with convexity in mind: favor small, staged entries rather than ‘all-in’ at the highs. If you’re trading spot, scale in on pullbacks; if you trade options, consider vertical call spreads to limit premium risk while retaining upside.
- Monitor ETF flow prints daily. Use them as a confirmatory signal: continued inflows support long bias; a sudden drop warns of a potential bull trap.
- Watch derivatives metrics: implied volatility, skew and in particular gamma exposure. If dealers are long gamma, intraday ranges may expand; if gamma flips, be ready for sharp reversals.
- Manage stop placement carefully. Given the erratic headlines, use technical levels informed by volume profile rather than tight stops that can be whipsawed.
For institutional allocators (time horizon: months+)
- Treat this as a macro-driven allocation decision, not a market-timing bet. If Bitcoin fits your strategic asset allocation thesis, consider dollar-cost averaging to avoid entry timing risk when volatility is headline-driven.
- Size ETF exposure with liquidity filtering in mind. Work with custodians and execution desks to understand how large buys will be sourced (spot vs OTC) and the likely market impact.
- Use options or structured overlays to express hypotheses while limiting downside — e.g., sell covered calls to monetize elevated implied vol, or buy protective puts to manage tail risk.
- Stress-test scenarios: model outcomes under both sustained ETF inflows and rapid flow reversals. Capital efficiency matters; ensure the allocation tolerates drawdowns if a bull trap unfolds.
Signals to watch this week (practical checklist)
- ETF inflow/outflow dashboard prints (daily). Consistent inflows = higher chance of continuation.
- Options open interest and put/call skew: rising call skew with increasing OI supports bullish continuation; rapid skew collapse is a red flag.
- On-chain accumulation vs distribution among long-term holders and exchanges’ net balances.
- Macro headlines: changes in oil or FX that relate to the Venezuela story could re-excite flows, so track energy markets closely (see CryptoSlate coverage on oil moves).
Final read: is this a sustainable macro-driven rally or a short-term spike?
The breakout to ~$93,000 was a hybrid event. A real geopolitical shock provided the narrative spark; ETF inflows and derivatives positioning supplied the fuel. Whether the move becomes a durable macro-driven rally depends on flow persistence and whether institutional allocators view this as a regime-shift in risk appetite rather than a tactical hedge tied to a single headline.
Practically speaking: if ETF inflows continue and on-chain metrics show genuine accumulation by long-term holders, the odds favor continuation. If flows fade and derivatives shorts or option sellers unwind aggressively, the market risks a bull trap. Intermediate traders should trade with smaller size and defined risk; allocators should prefer staged entries and active execution planning.
For traders looking to monitor tools and flows in real time, platforms that aggregate ETF and derivatives data — and execution partners like Bitlet.app for custody and trading workflows — can be useful as part of a broader toolkit.
Sources
- "Oil prices just did the unthinkable after the Venezuela raid and it hands Bitcoin a rare advantage" — CryptoSlate: https://cryptoslate.com/oil-prices-just-did-the-unthinkable-after-the-venezuela-raid-and-it-hands-bitcoin-a-rare-advantage/
- "Why is Bitcoin price going up after US operation in Venezuela?" — Crypto.news: https://crypto.news/why-is-bitcoin-price-going-up-after-us-operation-in-venezuela/
- "Bitcoin traders kick off 2026 with bets on price rally above USD100,000" — CoinDesk: https://www.coindesk.com/markets/2026/01/05/bitcoin-traders-kick-off-2026-with-bets-on-price-rally-above-usd100-000
- "Can BTC avoid bull trap at $93k? 5 things Bitcoin this week" — Cointelegraph: https://cointelegraph.com/news/can-btc-avoid-bull-trap-93k-5-things-bitcoin-this-week?utm_source=rss_feed&utm_medium=rss&utm_campaign=rss_partner_inbound
- "3 reasons why Bitcoin price is rising amid US operation Venezuela" — Coingape: https://coingape.com/3-reasons-why-bitcoin-price-is-rising-amid-us-operation-venezuela/