Why Ethereum Is Stuck in a 2026 Holding Pattern: ETF Noise vs. Structural Growth
Summary
Introduction — the paradox of activity versus price
Ethereum begins 2026 in an oddly familiar place: development activity is robust, rollup deployments multiply, and large players quietly accumulate, yet price action feels stuck. That tension between structural growth and short-term flow noise is the reason many traders struggle to separate headlines from durable signals.
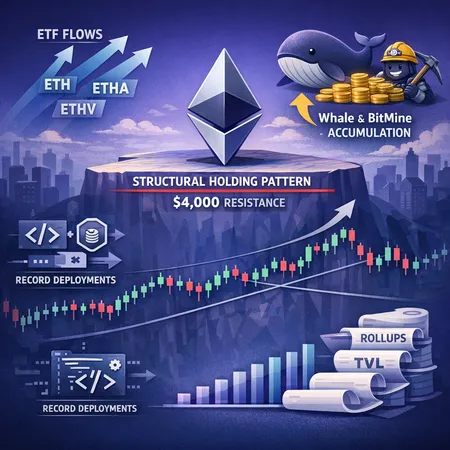
For many market participants, parsing ETF inflows and daily snapshots of funds like ETH, ETHA and ETHV feels like trying to read tea leaves. In reality, ETFs interact with on-chain demand, whale accumulation (notably BitMine), and macro liquidity to determine whether price follows fundamentals or simply trades on momentum. For context on price narratives and structural crossroads facing ETH, see the recent roundup and outlooks in the market commentary from CoinMarketCap.
Short-term price drivers: ETF flows versus large-actor accumulation
ETF flows are the obvious headline generator. Some days funds report net inflows and the headlines scream “institutional demand,” while other days funds show outflows and the narrative flips. Coverage showing inflows but a stagnant price highlights how flow alone can be noisy when arbitrage, market makers, and netting across funds mute the immediate price effect (BeInCrypto).
A concrete example of this microstructure is the daily ebb and flow of ETF balances: a snapshot on Dec 31 showed roughly $72M withdrawn despite many funds closing green on the month, a reminder that headline inflows don’t always translate to lasting demand (Blockonomi). That short-term whipsaw is a big reason ETH can feel stuck even while institutional interest exists.
Counterbalancing the ETF noise is concentrated accumulation by large players. Reporting on BitMine’s activity indicates accelerated accumulation trends among long-term holders and miners/large custodians that are quietly building positions (Crypto.News). When whales and entities like BitMine add slowly, they compress available float and set the stage for an eventual move — but it’s a slow burn rather than an immediate catalyst.
The practical takeaway for traders: treat daily ETF headlines as flow context, not definitive signals. Watch cumulative flows, changes in fund inventories, and on-exchange liquidity to gauge whether flows are net-increasing available buying power or merely rotating assets.
On-chain and developer signals: where the structural case is strongest
If you prefer hard, observable progress rather than daily headlines, look to developer activity and contract deployments. Ethereum is seeing record developer throughput and a surge in deployments that extends beyond speculative tokens into infrastructure and L2 primitives — evidence that builders expect the ecosystem to scale and persist (CryptoPotato).
Rollups and scaling matter here. As optimistic and ZK rollups mature, throughput increases while per-transaction fees drop, making Ethereum more competitive for DeFi, NFTs, and real-world use cases. That trajectory supports a structural uplift in demand, but the market needs time to translate more efficient UX and higher TVL into higher valuation multiples.
Total value locked (TVL) trends across rollups and L2 stacks are a useful intermediate indicator. Rising TVL accompanied by active addresses and growing revenue capture (fees, MEV, bridging) is what ultimately convinces long-term allocators to outsize risk budgets for ETH. Bitlet.app users and traders increasingly watch these metrics to distinguish speculative memecoin cycles from genuine DeFi-led adoption.
Technical outlook: trendlines, resistances and the $4,000 target
Technically, the path toward a $4,000 target demands a sustained resolution of both price and volume structure. Bulls cite the narrative that sustained accumulation (BitMine and whales) plus improving macro liquidity and ETF demand can fuel a breakout. Price-prediction roundups emphasize that ETH sits at a structural crossroads — a break above clustered resistance opens a clearer path to four figures (CoinMarketCap).
From a charting perspective, traders should watch three things:
- A reliable trendline breakout with follow-through volume (confirming buyers, not just short-covering)
- Clearing a zone of overlapping resistances — historically these cluster where prior range tops, moving averages and on-chain realized price bands converge
- Support behavior on pullbacks: whether previous resistance flips to support and whether on-chain accumulation continues during consolidation
If ETH can resolve the consolidation with above-average volume and ETF net inventories trending positive, the technical setup toward $4,000 becomes viable. Absent that, the market risks range-bound behavior where headlines create directionless intraday moves.
What institutional interest means for medium-term price discovery
Institutional entry via spot ETFs and large custodial accumulation changes the market’s plumbing. ETFs centralize flows and custody, which reduces friction for large allocations — theoretically improving depth and price discovery over time. But ETFs can also introduce intraday hedging and arbitrage flows that obscure true net demand.
The key to medium-term discovery is the balance between permanent buyers (long-term allocators, protocols, staking demand, BitMine-style accumulation) and transient liquidity (arbitrage desks, redemptions, short-term speculators). If permanent demand outpaces available float — driven by staking economics, rollup-driven revenue capture, and continued developer-led product launches — price discovery can shift upward.
However, several caveats matter: macro liquidity, interest rates, and cross-asset correlations still matter for institutional budgets. ETFs provide a distribution channel, but they don’t replace fundamental demand created by real usage. That’s why on-chain metrics (developer activity, TVL in rollups, contract deployments) remain essential inputs into any credible price prediction framework.
Practical frameworks for intermediate traders
If you trade ETH or analyze crypto markets, use a three-layer approach to cut through noise:
- Flow layer — monitor ETF inventories for ETH, ETHA, ETHV and large daily net flows; treat single-day headlines as noise unless corroborated by cumulative change. Refer to daily snapshots and fund reports rather than news tickers.
- On-chain & developer layer — track developer activity, contract deployments, and rollup TVL growth; these are medium- to long-term signals for sustained demand.
- Technical layer — require volume-confirmed breakouts and conviction around key trendlines and resistance clusters before betting on a move to $4,000.
Combining these layers helps avoid false breakouts driven by temporary ETF arbitrage or headline-driven volatility.
Scenarios: how a move to $4,000 happens — and how it doesn’t
Bull case: sustained net ETF inflows, continued BitMine/whale accumulation, accelerating TVL and revenue capture on rollups, and benign macro liquidity lead to a volume-confirmed breakout. Price follows adoption, not headlines.
Neutral case: inflows are offset by outflows and arbitrage; development activity continues but liquidity depth is insufficient to push price decisively past clustered resistance. ETH grinds sideways while on-chain metrics slowly improve.
Bear case: sudden macro tightening or large ETF redemptions combined with stop-heavy technical setups trigger downside; development activity remains healthy but price disconnects until liquidity returns.
Conclusion — patience and layered analysis win
Ethereum’s start to 2026 is not a failure of fundamentals; it’s a reminder that market structure, custody flows, and on-chain adoption operate on different timelines. ETF headlines make for good copy, but the real story is in developer velocity, rollup adoption, and whether large, patient buyers keep accumulating.
For intermediate traders and analysts, the edge comes from layering ETF flow data with on-chain metrics and robust technical confirmation. Keep an eye on cumulative ETF inventories (ETH, ETHA, ETHV), BitMine-style accumulation reports, and the rollout of rollup-native product markets — that combination will tell you whether a $4,000 target is probable or merely aspirational.
Sources
- https://coinmarketcap.com/alexandria/article/ethereum-eth-price-prediction-2026-xrp-hype-hyperliquid
- https://crypto.news/ethereum-price-bulls-target-4k-as-bitmine-accumulation-accelerates/
- https://cryptopotato.com/ethereums-price-stalls-but-developers-are-building-at-a-record-pace/
- https://beincrypto.com/ethereum-etf-inflows-but-price-stagnates/
- https://blockonomi.com/ethereum-spot-etfs-update-72m-withdrawn-as-all-funds-close-in-green/