Whales, On‑Chain Flows and Liquidity: Why PENGU Buyers and XRP Sellers Tell Different Stories
Summary
Overview: two whale stories, two market mechanics
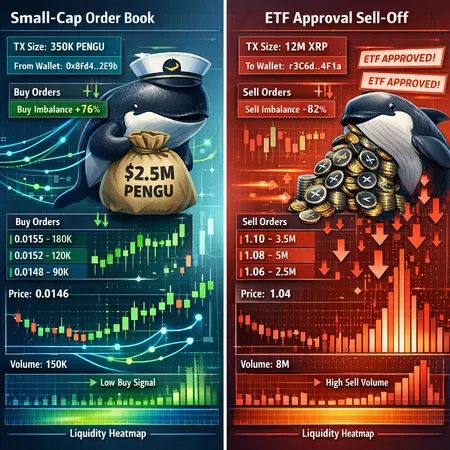
Last week illustrated a clear contrast in whale behavior. On the small‑cap side, large wallets accumulated PENGU — reported as roughly $2.5M scooped at the lows — a concentrated buy that can meaningfully change price discovery for illiquid tokens. By contrast, large XRP holders were reported to have sold into ETF approval news, adding selling pressure despite the bullish narrative around institutional products. The difference is not just scale: it’s motive, available liquidity, and the transmission path from on‑chain flow to spot price.
For context on the PENGU activity see the reporting that highlights the buy and the zones traders should watch, and for XRP the data pointing to whale selling and how ETF flows differ from BTC/ETH flows is relevant (PENGU whales scoop $2.5M at lows; XRP whales sold into ETF approval news; Why XRP ETF flows look different).
Reading the on‑chain signals: the core metrics
When a headline says “whales moved” you should translate that into measurable signals. The most actionable on‑chain metrics are:
- Exchange inflows/outflows: Large net inflows to centralized exchanges (CEXs) typically presage selling; net outflows often precede accumulation or hodling. Watch both absolute USD value and z‑score versus the coin’s historical mean.
- Top‑wallet concentration: Percent of circulating supply held by top 10 or top 100 addresses. A jump in concentration after a transfer signals accumulation by a few actors.
- Large transfers / transfer count: Number and value of transfers above a threshold (e.g., >$100k for niche tokens or >$1M for majors). A surge in large transfers can foreshadow a move.
- Realized/unrealized metrics and MVRV: For majors, MVRV and realized cap help understand whether holders are in profit and therefore more likely to sell into news.
- DEX vs CEX destination: Moving tokens into AMM pools or to DEX router addresses indicates readiness to provide liquidity or trade on‑chain; moving to CEX hot wallets suggests intent to sell to order books.
Use these metrics together — single indicators are noisy. For example, PENGU’s $2.5M accumulation looked significant because it represented a material percentage of recent liquidity, not just the dollar amount. Conversely, XRP whale selling was notable not just because whales moved tokens but because exchange balances and other flow signals corroborated selling intent.
Why whales act differently in small‑caps (PENGU) versus majors (XRP)
The incentives and constraints facing whales vary by token class.
For small caps like PENGU:
- Lower liquidity and fragmented order books mean a single whale trade can create large price moves. Buying $2.5M into a token with low 24‑hour volume can lift price sharply and attract retail momentum. Whales may be accumulation‑oriented (treasury buys, project insiders) or trying to create a favorable market structure before selling later.
- Concentration matters: If a handful of wallets control a large portion of supply, their behavior can define the token's price regime. That’s why the ambcrypto coverage of PENGU emphasizes specific zones and labeled whale addresses.
For majors like XRP:
- Deeper liquidity and institutional flows reduce single‑wallet price impact, but whales are often large custodial entities, funds, or exchanges with distinct motivations. In the recent case, whale selling coincided with ETF news — a scenario where holders may realize gains or rebalance rather than accumulate more exposure. CryptoQuant and on‑chain flow analysis highlighted selling pressure despite approval expectations, and Coinpedia noted ETF flows into XRP aren’t behaving like BTC/ETH flows, which changes how whales respond to the event.
In short: small‑cap whales can be market makers, accumulators, or manipulators; major token whales are often reallocating capital in response to macro or product‑level catalysts (ETF flows, custody rollouts, regulatory clarity).
Short‑term liquidity effects: how big wallet moves translate to price
Think of liquidity as a function of depth and time horizon.
- On order books, market impact ≈ trade size / immediate depth. For small caps, immediate depth is often thin — a $500k buy may sweep several price levels. Use the rule of thumb: avoid executing more than 5–10% of 24‑hour spot volume in a single trade unless you’re willing to accept slippage.
- On AMMs (Uniswap‑style pools), price impact follows an invariant curve; the larger the trade relative to pool reserves, the steeper the slippage. A whale routing through multiple pools can reduce price impact but will still move price across venues.
- Temporary vs permanent impact: A whale’s buy often causes a temporary liquidity vacuum that other traders exploit (momentum traders, MEV bots), producing volatility. Permanent impact requires a sustained imbalance (e.g., repeated accumulation or a genuine change in sell pressure).
Practical numeric heuristics:
- If a single transfer equals >20% of 24‑hour volume in a small cap, expect pronounced price moves and higher short‑term volatility.
- If exchange inflows for a major spike to >2 standard deviations above the 30‑day mean, interpret that as meaningful supply pressure that can lower prices even if fundamentals are bullish.
Interpreting whale flows for risk management — a checklist for traders and quants
Translate flows into trading rules rather than gut reactions. Use this checklist before sizing positions:
- Contextualize the flow: Is the transfer headed to a CEX, DEX router, or cold storage? CEX destination increases near‑term selling risk.
- Relative size: Compare the whale move as a percentage of 24‑hour volume and of circulating supply. Bigger relative moves = higher impact and higher precaution.
- Confirm with order books: Before entering, check top‑of‑book depth and aggregated depth to see how much slippage your intended size would create.
- Look for corroborating signals: Exchange netflow, labeled wallet identity (is it an exchange or a known project wallet?), and social/derivatives data (open interest shifts, basis) help triangulate intent.
- Dynamic sizing: For small caps, cap your trade at a fraction of observed whale buys (e.g., do not allocate more than 10–25% of a whale’s accumulation size, depending on your risk tolerance). For majors, use liquidity‑based sizing (percent of bid depth rather than percent of portfolio).
- Plan exits and hedges: Use stop losses tied to volatility (ATR) or laddered exits to manage the possibility that a whale reverses. If the whale sells into an event (like an ETF approval), consider hedging tail risk with options where available.
Applying these rules can prevent getting caught on the wrong side of an ostensibly bullish headline or a seemingly bearish whale move.
Tools and metrics to monitor whale activity (practical toolkit)
A combined tech stack yields the best signal-to-noise ratio. Key platforms and the metrics to extract from them:
- Nansen / Arkham: Wallet labeling and cluster analytics. Use these to identify whether a large transfer came from an exchange, a fund, or a known whale cohort.
- CryptoQuant / Glassnode: Exchange balance flows, netflow z‑scores, realized/unrealized metrics, and MVRV. CryptoQuant was cited in coverage about XRP whale selling highlights.
- Dune / custom queries: Build bespoke dashboards to track transfer sizes, top‑wallet concentration over time, and DEX vs CEX routing for a token like PENGU.
- Whale Alert / on‑chain monitors: Fast notifications for large single transfers — useful for intraday traders.
- Order book and depth tools: For CEXs use native APIs or aggregator UIs to preview the slippage curve; for AMMs, simulate swaps against pool reserves.
- Block explorers: Etherscan or equivalent for chain of interest to trace token movements to contract or hot wallet addresses.
Set alerts for a few tailored thresholds: e.g., exchange inflow z‑score >+2, single transfer >X% of 24h volume, or top‑10 holders’ share increasing by >Y% in 24 hours. These thresholds should be calibrated by token liquidity class. Bitlet.app can be part of your workflow for trade execution and contextualizing signals at the time you act.
Practical examples: what the PENGU and XRP flows tell us this week
PENGU: The reported accumulation (roughly $2.5M) mattered because it occurred at a price regime with low liquidity and because labeled on‑chain movement suggested concentrated wallet buying. That pattern typically leads to short‑term price appreciation followed by increased retail participation and volatility. Traders who saw the accumulation and confirmed shrinking sell depth on CEX order books could have scaled in with tight risk controls and smaller position sizes relative to the whale amount.
XRP: Reporting tied whale selling to ETF news, and CryptoQuant analysis (cited in coverage) found selling pressure from large holders even as headlines celebrated ETF developments. Coinpedia emphasized that ETF flows into XRP behave differently than historical BTC/ETH ETF dynamics — custodial mechanics and where cash flows land can create immediate supply even as long‑term demand narratives improve. For traders, the lesson is clear: don’t assume that product launch or approval = instant accumulation by whales. Often, the opposite occurs as profit‑taking or rebalancing happens at these liquidity events.
Actionable heuristics — quick reference for live trading
- Treat a single whale transfer >20% of 24h volume in a small cap as a red flag for high volatility. Reduce size or tranche entries.
- If exchange inflows for a major token exceed +2 standard deviations, assume elevated selling risk in the next 24–72 hours.
- Use labeled wallets: accumulation by a foundation/treasury is different from accumulation by an exchange cold wallet; weight your hypothesis accordingly.
- For execution: never exceed the depth required to move more than 1–3% adverse slippage on your trade for majors; for small caps target sub‑1% of the free float if you want to avoid signaling.
Conclusion: translate flows into probabilities, not narratives
Whale movements are informative when placed into the right context. A PENGU whale buying $2.5M in low liquidity has a different implication than XRP whales selling into ETF news; the former can kick off a short squeeze and momentum trade, the latter can temporarily overwhelm constructive narratives. Active traders and quants should combine exchange flow metrics, labeled wallet context, depth analysis, and volatility sizing rules to convert on‑chain signals into disciplined trading decisions.
Sources