Bitcoin’s Renewed Bear Case: Unpacking Brandt’s Parabolic Warnings and a Practical Risk-Management Playbook
Summary
Why Brandt’s warning matters now
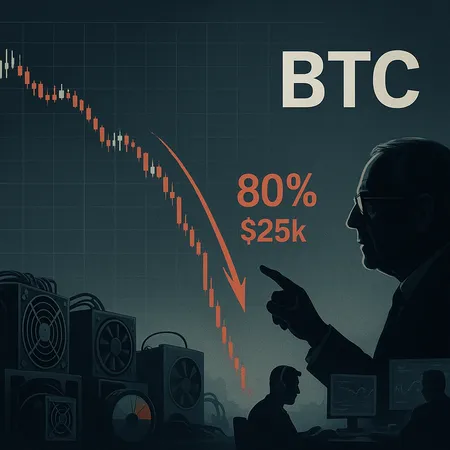
Peter Brandt is not a household name for casual traders, but among technical analysts his calls carry weight because they combine classic chart patterns with strict risk discipline. Recently Brandt highlighted a parabolic structure violation and described scenarios where Bitcoin could retrace very deeply — narratives that include large percentage losses and price calls toward $25k. Coverage summarizing his view is available at AmbCrypto and CryptoPotato, where the mechanics and the worst-case framing are outlined (AmbCrypto, CryptoPotato).
Brandt’s thesis is essentially technical: when an asset leaves a parabolic ascent and that structure is violated, declines can be fast and severe because momentum buyers exit and systematic traders hit stops. For BTC — an asset with outsized leverage and a retail base prone to FOMO — the consequences of such a structural break can be magnified. That said, technical signals alone are not sufficient to make portfolio-level decisions; they should prompt a cross-check against on‑chain metrics and macro conditions.
How a "parabolic collapse" works in practice
A parabolic advance is defined by accelerating slope and decreasing pullbacks; it looks like a curve that steepens until buyers run out of fuel. The danger is two-fold: first, once the slope breaks, there are few technical support zones left between price and much lower levels; second, the break often triggers convex reactions — steep daily moves that cascade as leveraged positions unwind.
In Bitcoin’s case, the putative collapse scenario follows a familiar script: extended parabolic leg → first violation (daily close below key trend structure) → stop cascade and panic selling → liquidity vacuum and fast re-pricing. Depending on where large holders are positioned and how derivatives are margined, that cascade can produce 50%+ corrections — and proponents of Brandt’s extreme case argue for moves approaching 80% under specific conditions. The examples cited in recent coverage make that tail risk explicit and should be treated as a plausible, if low-frequency, outcome.
On-chain and macro overlays that increase tail risk
Technical breaks become far more dangerous when on‑chain and macro signals are aligned. Three current items deserve attention.
Hash rate shock: Reports that China-related mining shutdowns led to a sharp drop in BTC hash rate (roughly 400k machines affected in some accounts) are important because a cratering hash rate can change miner behavior. Finbold and other outlets documented the plunge and the potential for miners to sell BTC to cover costs when revenue falls (Finbold). Selling pressure from miners during a volatile drop can lengthen and deepen corrections.
Policy uncertainty and liquidity: The Fed and major central banks remain central to risk appetite. Unanticipated hawkish moves or signaling that tightens financial conditions can pressure risk assets — crypto included. When liquidity is tight, forced deleveraging in derivatives markets accelerates downside moves.
Sentiment: The Fear & Greed index returned to extreme fear in recent readings, a classic contrarian indicator but also a sign that market participants are positioned defensively (Coindesk). Extreme fear can reduce bid-side resilience during a technical break and increase the probability of follow-through selling.
Combine these with tactical price breaks — such as breaches below recent major reference levels noted by market analysts — and the odds of an elongated correction grow (see recent market commentary on mid-range structural breaks at InvestingCube for context) (InvestingCube).
Scenario map: what to watch and roughly how to think about probabilities
No one can deliver certainties, but mapping scenarios helps. Below are stylized outcomes and the primary drivers that would shift probabilities:
Shallow correction (20–40%): Triggered by transient macro jitters or a liquidity shock absorbed by robust buy-side interest. Rebound occurs within weeks; volatility spikes but mean reversion returns.
Deep correction (40–60%): Triggered by combination of parabolic break and temporary miner selling / derivative deleveraging. Takes months to stabilize; on‑chain metrics show capitulation (outflows from exchanges, rising supply on exchanges).
Parabolic collapse / tail event (60–80% to the low tens of thousands): Requires severe liquidity drain, large-scale miner distress, and a negative macro shock that forces risk-off across asset classes. This is low probability but high impact — the kind of event Brandt warns about.
When assigning blunt probabilities, a balanced intermediate trader might treat shallow correction as the highest probability, deep correction plausible, and parabolic collapse a low-probability tail — yet one whose expected cost (probability × loss) can justify hedging if exposures are large.
A practical risk-management playbook (for traders and allocators)
Below are concrete tactics that fit different profiles: active trader, portfolio allocator, and institutional-like manager. Mix and match; cost matters.
Position sizing and risk budgeting
Rule of thumb: risk no more than 1–2% of portfolio equity on directional active trades; for concentrated BTC allocations, cap single-asset exposure to a predefined percentage (e.g., 3–10% of total portfolio depending on risk tolerance). Use a position-sizing formula: Position Size = (Account Risk in $) / (Entry Price - Stop Price).
For allocators with strategic BTC exposure, set a maximum drawdown tolerance (for example 30–40%). If backtests show a possible 70% drawdown, cap allocation so the maximum theoretical loss stays within tolerance.
Hedges and instruments
Options: Buy puts (protective puts) for outright downside insurance. Long-dated puts (3–6 months) blunt the risk of fast collapses but can be costly. Consider put spreads to reduce premium: buy a nearer-the-money put and sell a lower strike to shave cost.
Futures and perpetuals: Use size-limited short futures to hedge directional exposure. Beware of funding-rate costs on perpetuals and margin pressure in fast moves.
Inverse ETFs/products and structured notes: For smaller allocators, single-ticket inverse products can provide simple hedges but check counterparty and tracking risks.
Tail hedges: Put-buying should be sized explicitly as insurance: hedge X% of BTC allocation where X reflects your risk aversion and cost tolerance (e.g., hedge 25–50% of BTC exposure via options if you expect a severe tail over a 3–6 month window).
Dynamic rules and triggers
Tighten protection on technical violation: If price closes below a pre-defined curve (e.g., daily close below a parabolic trendline or below the 200-day moving average), increase hedge size by a set increment (for example +25% of planned hedge allocation).
Increase convex hedges when on-chain stress rises: If hash rate drops by a preset threshold (say 15–20% week-over-week) or exchange inflows spike, rotate toward longer-dated puts or add short futures.
De-risk on macro shock: If the Fed delivers a surprise rate move or liquidity shock, reduce directional bet size and roll up hedges as needed.
Entry and re-entry triggers
Technical reclaim: Consider removing hedges or re-entering incrementally after BTC reclaims on-chain/technical levels such as reclaiming the broken trendline for several daily closes or regaining a major moving average on strong volume.
Hash rate and miner stability: A durable recovery in hash rate and stable miner behavior (less forced selling) is a key on‑chain signal to reduce defensive posture.
Sentiment normalization: A sustained movement of the Fear & Greed index from extreme fear toward neutral/greed for multiple weeks suggests market risk appetite has returned and can be a signal to rebalance risk-on allocations.
Cost-aware implementation
Recognize hedging is expensive: options premiums and collateral costs add drag. Treat hedges as insurance — size them to balance protection against performance drag.
Ladder hedges: Instead of one big hedge, ladder time and strikes to smooth cost over periods and capture tail events without paying all premium upfront.
Practical checklist and trade templates
If BTC daily close < parabolic trendline: deploy initial hedge covering 25–50% of BTC exposure (mix of puts and short futures). Tighten if price moves lower.
If hash rate drops >15% within 2 weeks: add convex protection (long-dated puts) equal to an additional 10–25% of BTC allocation.
If Fear & Greed < 25 and exchange inflows spike: move to defensive allocation (raise cash/stablecoins to target level, reduce directional exposure by 10–30%).
Re-entry: scale back hedges in 25% increments when BTC establishes several daily closes above the broken trendline or relevant moving average and hash rate recovers to pre-shock levels.
Example trade: Allocator with 5% BTC strategic exposure
Maximum tolerated drawdown 35% → keeps allocation at 5% because a 70% crash would cause a 3.5% portfolio loss.
Insurance: buy 3-month puts covering 50% of BTC exposure (cost 0.5% of portfolio). Ladder another 3-month put purchased at month 2 if conditions worsen.
Tactical shorts: up to 10% of BTC allocation in short futures for immediate convex protection during a fast-moving break; close when market stabilizes.
Final thoughts: balance prudence with opportunity
Brandt’s parabolic-collapse warnings are a useful reminder that technical patterns can precede violent moves in crypto. But the chart is one input among many. When technical signals line up with on‑chain stress (hash rate shocks, miner selling) and macro/sentiment deterioration, the case for active protection strengthens.
Risk management is about sizing, timing and cost-efficiency. Use rule-based hedging that you can follow without emotion, monitor on‑chain and macro signals closely, and keep clear re-entry criteria so you don’t miss the next bull leg when conditions normalize. For platform-native execution and structured products that can help implement hedges and staged buys, consider services like Bitlet.app as part of your operational toolkit.
Sources
- https://ambcrypto.com/parabolic-structure-violated-why-peter-brandt-sees-bitcoin-sliding-toward-25k/
- https://cryptopotato.com/bitcoin-btc-risks-80-drop-peter-brandt-flags-parabolic-collapse/
- https://finbold.com/bitcoin-hash-rate-plunges-as-china-shuts-down-400k-mining-machines-btc-crash-next/?utm_source=snapi
- https://www.coindesk.com/markets/2025/12/15/fear-and-greed-index-in-fear-30-of-the-past-year-bitcoin-back-in-extreme-fear
- https://www.investingcube.com/cryptocurrency/bitcoin-price-below-90k-a-healthy-correction-or-brewing-trouble/
For on-chain context and market framing, traders often track Bitcoin headlines and broader DeFi liquidity narratives when building hedges and entry plans.