Uniswap (UNI) Technical Outlook: Why $8.50–$10.66 Is a Realistic Recovery Window
Summary
Executive thesis
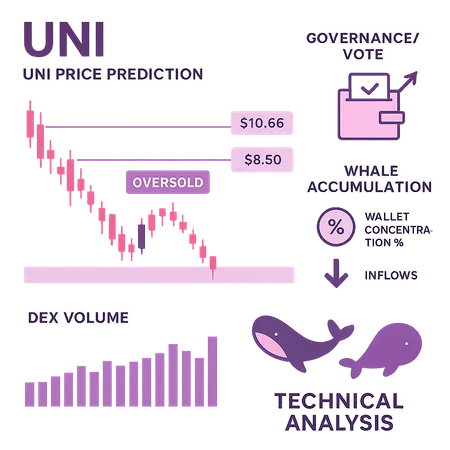
Uniswap's native token, UNI, shows a technically plausible path back to $8.50–$10.66 if short‑term oversold conditions coincide with continued whale accumulation and a pickup in DEX volume. On the charts, the bullish case depends on a base/mean‑reversion recovery (RSI and momentum reset), reclaim of key moving averages, and a clear shift in on‑chain liquidity flows that would validate higher highs. This piece ties the technical indicators to chain‑level behaviour and offers an operational trade plan for intermediate traders and DeFi investors.
Why the $8.50–$10.66 window matters (technical basis)
The $8.50–$10.66 target is not pulled from thin air — it maps to a near‑term resistance band formed by prior weekly range highs and a confluence of moving average resistance in a typical recovery scenario. The technical checklist that supports such a rebound is:
- Oversold momentum: A sustained RSI below ~35 on daily charts signals exhaustion and increases odds of a mean‑reversion leg. That’s the classical starting point for measured recoveries.
- Moving average confirmation: A sequence where price first reclaims the 50‑day MA (near‑term trend) and then the 100–200 day MAs provides a ladder for technical buyers to step in.
- Volume confirmation: Rising on‑chain and DEX volume on green days (more token flow through Uniswap pools and higher swap counts) confirms real demand rather than a short squeeze.
- Liquidity clusters and orderbook psychology: The $8.50–$10.66 band often aligns with previous congestion zones where stop liquidity and resting bids intersect; breaking through it puts UNI back into a stage where range extension to higher resistance is likely.
Those technical pieces are the backbone. Independent reporting has already highlighted oversold conditions and accumulating large holders as a bullish catalyst; for example, blockchain.news reports a technical setup and whale accumulation that underpins price targets in the mid‑single digits to low double digits.
Short technical checklist for traders
- Confirm RSI divergence or weekly oversold reset.
- Watch for daily close above the 50‑day MA with above‑average DEX volume.
- Use the $8.50–$10.66 band as first take‑profit zone; larger structural targets require further confirmations.
On‑chain whale accumulation: what it means for upside risk
On‑chain accumulation by large wallets changes the supply dynamics and can substantially increase the asymmetry of an upside move.
- Why whale accumulation matters: When a significant portion of the free float concentrates in fewer wallets, it reduces available sell pressure at marginal prices. That can amplify rallies because fewer coins are easily available to sell into upward moves.
- What to watch on chain: wallet inflows to cold stores, transfer activity from exchanges to self‑custody, and increasing balances within a cohort of addresses. These are the classic signs whales are preparing to hold rather than trade.
- Practical interpretation: Accumulation alone doesn’t guarantee price appreciation; timing is critical. However, accumulation combined with oversold technicals increases the probability that any relief rally gains traction and becomes self‑fulfilling as liquidity thins.
The market narrative also groups large‑cap Alts by catalysts and capital flows — macro reporting has highlighted how big names cluster together when capital reallocates, which increases the likelihood of correlated recoveries among the DEX/gov token cohort like UNI (U.Today discussed this macro grouping and narrative dynamics).
Interplay between DEX volume and UNI price
Discounted token prices can remain static until real economic activity returns. For UNI, the most direct on‑chain demand signal is DEX volume — swaps, liquidity additions, and programmatic activity.
- Positive feedback loop: Higher DEX volume → greater swap fee capture for liquidity providers → more incentive to supply liquidity → healthier AMM depths and less slippage → larger traders re‑enter DEXs → price discovery supports higher token valuations (especially if governance expectations rise).
- Leading indicator: A rise in daily TVL and swap count often precedes a sustainable price move; watch for a week‑over‑week uptick rather than a single‑day spike.
- Volume quality vs. quantity: Not all volume is equal. Organic user swaps and new liquidity additions are higher quality than wash trading or router arbitrage. On‑chain analytics that filter for unique addresses and non‑programmatic flows are useful here.
If on‑chain analytics start showing a sustained recovery in swap volume and net new liquidity to Uniswap pools, the technical target window becomes a higher‑probability event.
Catalysts that could accelerate the move
- Governance wins: Meaningful governance proposals that improve fee economics, token utility, or revenue share mechanics can re‑price UNI rapidly as future cash flows become more attractive. A well‑timed governance win is a credible accelerator.
- Protocol upgrades or partnerships: Announcements that materially increase DEX throughput or cross‑chain integrations can lift speculative demand.
- Macro rotation to Alts/DeFi: A sustained capital rotation away from BTC and into DeFi (or a risk‑on macro swing) often concentrates flows into governance tokens like UNI.
Each catalyst increases conviction, but traders should require on‑chain confirmation (volume, whale behavior) before adding size.
Practical trade framework and position sizing (for intermediate traders)
Below is a disciplined trade plan you can adapt to your own risk tolerance and time horizon. Nothing here is investment advice — treat it as a clear framework.
Define risk per trade: 1% of portfolio is a common conservative limit for active positions; intermediate traders may use 1–2%. Calculate absolute dollar risk before entering.
Entry approaches (pick one based on temperament):
- Aggressive: enter on daily pullback with RSI still below neutral but showing divergence. Smaller size + tight scaling plan.
- Base‑builder: scale in smaller tranches across the oversold band; add on reclaim of the 50‑day MA.
- Confirmational: wait for daily close above 50‑day MA + rising DEX volume; larger initial size.
Stop‑loss placement: place stops below a logical technical invalidation point — a weekly structural low or below a major liquidity shelf. Quantitatively, many traders choose a stop that risks 4–8% of the trade entry price so that position sizing aligns with the 1–2% portfolio risk.
Targets & scaling: use the $8.50–$10.66 band as a first major target for partial profit-taking (30–50% of position). Let the remainder run with a trailing stop or move the stop to breakeven after the first target is hit.
Position sizing example: with a $100,000 account and 1% risk tolerance ($1,000): if your stop is 8% away from entry, maximum position size = $1,000 / 0.08 = $12,500. Adjust entries and stops to meet desired exposure.
Risk controls: avoid allocating more than 4–6% total portfolio to correlated DeFi/gov tokens at any time. Use portfolio‑level stop logic and periodic rebalancing.
Platforms like Bitlet.app can help manage trade execution and installment strategies for longer horizon positions, but execution quality and fees matter — always factor them into your sizing.
Invalidation and contingency planning
The thesis fails if:
- RSI remains depressed and price breaks below the prior weekly structural low with expanding sell volume (indicative of distribution rather than accumulation).
- Large wallets begin distributing to exchanges in meaningful size (on‑chain outflows to exchanges).
- DEX volume declines or is dominated by low‑quality wash trading (no organic user growth).
If any of the above happens, tighten stops and reduce exposure; consider flipping to a short bias only with clearly defined shorting rules and risk controls.
Final checklist before entering
- Verify RSI and momentum show oversold exhaustion or bullish divergence.
- Confirm whale accumulation trend (net inflows to cold wallets or decreasing exchange balances).
- See at least a 3–7 day uptick in DEX volume or TVL rather than a single‑day spike.
- Define stop, size for 1–2% portfolio risk, and set profit‑taking rules targeting the $8.50–$10.66 band.
Sources
- Price prediction and technical/whale accumulation context — Blockchain.News
- Macro grouping and capital flow context for large‑cap alts — U.Today
For broader context on DeFi market cycles and how token utility and DEX activity interact, see related coverage on DeFi. For macro risk rotation guidelines that often precede alt rallies, many traders still watch Bitcoin as a market bellwether.