Is Altseason Finally Here? Reconciling Bitcoin Dominance, Rotation Signals, and Which Alts Could Lead
Summary
Executive snapshot
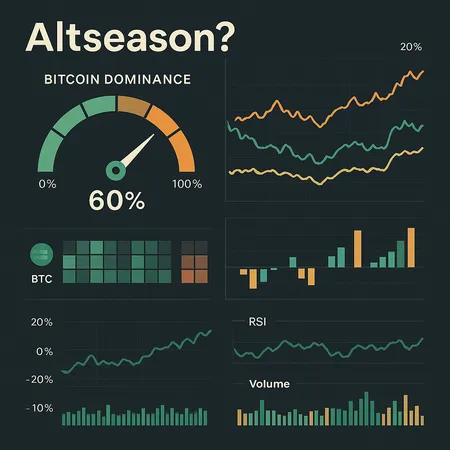
The headline: bitcoin dominance has dropped below 60%, a level that in past cycles often preceded periods of strong altcoin performance. Yet commentary is split — some see the fall as the opening bell for altseason, while others warn rotation is still delayed amid deleveraging and weak breadth. This article reconciles those views, looks at where SOL, LINK and ZEC stand today, and gives practical, data-driven screening criteria and a tactical framework for portfolio managers and altcoin investors weighing whether to increase alt exposure or wait for clearer confirmation.
For many readers the term altseason is shorthand for a market regime where altcoin rotation outpaces BTC, market breadth improves, and diversified alt positions outperform a BTC-only stance. We use that operational definition here.
What the recent Bitcoin dominance dip means — and what it doesn't
Bitcoin dominance measures BTC market cap as a share of total crypto market cap. When dominance falls, it means capital is rotating into altcoins, or Bitcoin is stalling while the broader market rises. Coverage noting the dominance drop below 60% argued it may signal an incoming altwave (CoinPedia). That observation is useful but incomplete.
A dominance inflection is a necessary but not sufficient condition for a sustainable altseason. In both 2017 and 2020–21, meaningful alt rallies followed sustained dominance declines combined with: rising altcoin volume, improving market breadth (many alts making higher lows), expanding DeFi activity and strong on-chain fundamentals. By contrast, short-lived dominance dips accompanied by BTC price sell-offs or systemic deleveraging did not produce broad-based alt outperformance.
Crypto writer consensus is split: some outlets flagged the dominance move as a material shift, while others emphasize that rotation remains delayed amid risk-off positioning and deleveraging pressures (Crypto Economy). Both can be true at once: dominance can fall during early-stage rotation even if the bulk of yield-chasing alt flows — and the market breadth that sustains rallies — haven’t yet arrived.
Reconciling the signals: sequence matters
Think in terms of a sequence rather than a binary trigger. Historically the typical sequence before a durable altseason is:
- BTC stabilizes or posts a modest grind higher after a capitulation leg. That removes the single biggest tail-risk.
- Bitcoin dominance falls as risk capital reallocates. Early movers are often large-cap alts and infrastructure tokens.
- Market breadth expands: a growing number of altcoins break important moving averages and show rising active addresses and on-chain flows.
- Derivatives and funding-rate asymmetry shift to favor longs in alt markets, reducing liquidity friction and enabling rallies.
A lone, fast drop in dominance can be caused by a one-off rotation into a handful of listed tokens or by temporary macro flows. To call an altseason you want to see the middle two bullets (breadth + derivatives/flows) confirm the initial dominance move.
How SOL, LINK and ZEC are behaving — leading, lagging, or noise?
News outlets have highlighted specific alts with fundamentals that could outperform if rotation gathers steam. For a synthesis, see recent coverage pointing to opportunistic leadership among certain protocols (NewsBTC). Below is a data-driven assessment for SOL, LINK and ZEC.
SOL (Solana) — high beta infrastructure play
- Why it could lead: Solana is a liquidity and developer magnet in NFT, gaming and some DeFi niches. High on-chain activity and large ecosystem token utility make SOL a natural early beneficiary when traders seek growth exposure.
- Risks: SOL historically exhibits high correlation with risk appetite and wide volatility spikes; network outages or declining TPS metrics can quickly reset sentiment.
- Signals to watch: steady rise in unique active addresses, TVL and DEX volumes on Solana. Also monitor SOL funding rates and BTC correlation — decoupling or improved relative strength vs BTC is an early sign of leadership.
LINK (Chainlink) — fundamental oracle demand
- Why it could lead: Chainlink's utility is protocol-agnostic — any smart contract requiring external data may need oracles. That gives LINK a more defensible fundamental narrative than narrative-only tokens.
- Risks: LINK’s performance often tracks broader smart-contract activity; if DeFi usage remains muted, LINK gains may be capped.
- Signals to watch: growth in oracle requests and new integrations, daily data-feeds usage and a rising number of smart contracts paying fees to Chainlink.
ZEC (Zcash) — niche privacy asset with episodic demand
- Why it could lead: ZEC is a privacy-focused coin that occasionally benefits from specific flows when privacy demand or regulatory nuance re-enters market conversations.
- Risks: Privacy coins can be volatile on regulatory headlines and often have lower liquidity than large-cap alts; that increases tail-risk during deleveraging.
- Signals to watch: exchange inflows/outflows, trading depth, and any on-chain indicators of increased shielded transactions.
All three have plausible leadership cases but different risk-return profiles. SOL is high-beta, LINK is fundamental-infrastructure, and ZEC is niche/episodic.
Indicators that historically precede broad alt rallies
If you’re deciding whether to increase alt exposure, prioritize indicators that historically signalled durable rotation rather than false starts. Key signals to track:
Market breadth: number of altcoins above their 50- and 200-day moving averages, and the share of top-200 tokens making new 30- and 90-day highs. Breadth expansion is one of the most reliable early confirmations.
Alt market-cap share sustained decline in BTC dominance: a persistent drop (weeks) below thresholds like 60% rather than a single-day print.
Volume rotation: rising spot volume for altcoin pairs (especially USD/USDT and BTC pairs) and increasing DEX volumes. This suggests real spot capital is flowing into alts.
On-chain activity: rising active addresses, unique contracts interacting, growing TVL for DeFi platforms on multiple chains.
Derivatives positioning: shift in funding rates (alts flip to net positive funding), and alt open interest increasing relative to BTC. Long-biased funding rates in alts reduce the cost of leveraged long exposure.
Exchange flows: net inflows into altcoin ETFs/ETNs or spot altcoin custody on exchanges; decreasing exchange reserve for specific tokens can be bullish.
Correlation and relative strength: a falling correlation between top alts and BTC and improving alt/BTC relative-strength ratios (i.e., alt/BTC price charts forming higher lows).
Macro and liquidity backdrop: accommodative liquidity, stable risk-free rates and improving risk-on sentiment in credit and equities markets often accompany alt rallies.
No single indicator is sufficient. Use a composite approach: when several of these align, the probability of a sustainable altseason meaningfully increases.
A practical screening checklist for alts likely to lead
Below is a pragmatic checklist portfolio managers can use to filter candidates before increasing exposure. Treat items as scoring criteria rather than hard pass/fail gates.
- Liquidity and depth
- Minimum average daily volume (spot) relative to desired position size; avoid tokens where your ticket would exceed a meaningful share of 24h volume.
- On-chain usage
- Rising active addresses or contract interactions over a 30–90 day window; for Chainlink look for oracle request growth, for Solana check dApp usage and TVL.
- Developer activity
- Increasing commits, deployments, or new protocol launches; GitHub or ecosystem dashboards provide signals of sustained product momentum.
- Tokenomics and supply schedule
- Transparent issuance model, staking utility or fees that sustainably reduce circulating supply (or generate flow demand).
- Derivatives profile
- Open interest trending up with balanced funding rates; tokens dominated by very high negative funding (short squeezes) or extremely high perpetual rates are riskier.
- Correlation and relative strength vs BTC
- Low or falling correlation with BTC and an improving alt/BTC RS line; this reduces the chance your alt position simply collapses with BTC.
- Regulatory and concentration risk
- Reasonable distribution of holders (not overly concentrated) and low exposure to imminent regulatory clampdowns (important for privacy or stablecoin-adjacent projects).
- Narrative + catalysts
- Upcoming protocol upgrades, major integrations, or fee-revenue drivers that could act as demand catalysts.
Score tokens across these axes; allocate more to higher-scoring assets while keeping portfolio-size constraints.
Tactical sizing and risk management for portfolio managers
If several altseason indicators align, consider a phased allocation approach:
Stage 1 (Early rotation signal): Small increase (e.g., +5–10% of risk budget) into high-conviction, liquid alts (large-cap SOL, LINK). Use limit orders to avoid chasing.
Stage 2 (Breadth confirmation): If market breadth and derivatives flows confirm, scale into mid-cap leaders and thematic plays (additional +10–20%). Reassess liquidity constraints and correlation.
Stage 3 (Mature alt rally): If the altparty broadens and the majority of your screened tokens meet criteria, you can rotate further while trimming winners to rebalance risk.
Risk controls:
- Hard exposure caps to any single alt and to overall alt allocation. Don’t exceed a pre-defined maximum alt share of total crypto risk budget.
- Use trailing stops or systematic rebalances tied to BTC correlation or volatility regimes.
- Maintain an allocation to BTC as hedge against idiosyncratic alt collapses; historical altseasons can still see BTC spikes that re-concentrate dominance.
Tools like Bitlet.app can help implement installment buys or dollar-cost-average strategies across alt pairs if you decide to phase exposure in.
Practical example: how to apply the checklist to SOL, LINK, ZEC
- SOL: high marks for on-chain usage and developer activity, good liquidity — score favorably for Stage 1/2 sizing. Watch for network stability and funding-rate shifts.
- LINK: strong fundamental demand signal potential via oracle usage; lower volatility than SOL historically — useful for base allocation during Stage 1.
- ZEC: niche use case with episodic demand and lower liquidity — treat as satellite exposure and only after breadth confirmation.
This mapping ties back to the NewsBTC thesis that certain fundamentally strong alts could outperform when rotation arrives, while also respecting Crypto Economy’s caution that rotation can remain delayed until deleveraging ends.
Red flags and how to avoid false starts
Be cautious if you observe any of the following alongside falling BTC dominance:
- Dominance drop driven by a single token or a handful of tokens while the rest of the market is stagnant.
- Alt funding rates remain deeply negative or open interest collapses — indication of liquidation-driven moves rather than organic flows.
- Spot volumes are concentrated on derivatives venues or dark pools rather than broad exchange liquidity.
- Macro shock or credit stress that could reintroduce risk-off dynamics instantly.
If these red flags persist, prefer smaller, tactical exposures and wait for breadth and on-chain confirmation.
Decision framework — increase exposure or wait?
Ask three sequential questions before adding meaningful alt exposure:
- Is BTC price stable or trending upward on a risk-adjusted basis? If BTC is still collapsing, alt exposure is higher risk.
- Has bitcoin dominance decline been sustained for multiple weeks and accompanied by rising alt spot volumes? A one-day print is not enough.
- Are market breadth and derivatives positioning confirming (more alts above key MAs; positive alt funding rates)?
If you answer yes to all three, increasing exposure via a staged approach is reasonable. If one or more answers are no, prefer smaller, opportunistic positions and a watchful stance.
Conclusion
A dip in bitcoin dominance below 60% is an important signal — but not a standalone confirmation of altseason. Historical alt rallies required a sequence of confirmations: BTC stabilization, sustained dominance decline, breadth expansion, and flow/derivative alignment. SOL, LINK and ZEC each have plausible leadership cases but different risk profiles; use a structured screening checklist and phased sizing to participate while protecting capital. Balance conviction with humility: in crypto, confirmation matters more than hope.
For ongoing tracking, monitor breadth metrics, funding-rate heatmaps, on-chain demand signals and spot volume rotation. Incorporate these into your portfolio playbook rather than chasing headlines, and you’ll be better positioned whether altseason is arriving now or still delayed.