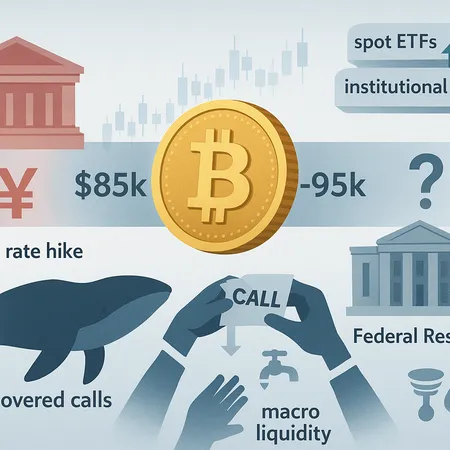
Why Bitcoin Is Stuck Between $85k–$95k: Macro Risks, ETF Demand, and Whale Options
Summary
Executive snapshot
Bitcoin sits in a narrow, well‑traded band between roughly $85k and $95k. On one hand, spot ETF demand has delivered steady structural buying; on the other hand, macro friction — primarily fears about a Bank of Japan (BoJ) rate shift and lingering U.S. policy uncertainty — plus deliberate options strategies from large holders are keeping volatility and price discovery muted. This article breaks the interplay down, points to the most useful metrics and on‑chain flows to watch, and outlines trading and portfolio tactics to manage the risk of either a breakout or extended stagnation.
How a BoJ rate hike can pressure Bitcoin and risk assets
The BoJ has long been a global liquidity backstop through ultra‑easy policy that encouraged carry trades and supported risk assets. A credible BoJ rate hike changes that calculus: it tightens global FX and fixed‑income carry, strengthens the yen, and can trigger a re‑pricing of risk across equities and crypto.
Historically, episodes of tightening in major central banks — or even credible hikes in previously dovish ones — have led to cross‑asset volatility as leveraged carry positions and risk premia adjust. Recent reporting highlights growing market fear that a BoJ pivot could be a catalyst for reallocation away from risk assets, including BTC, by tightening macro liquidity conditions and altering the flows that underpinned rally dynamics. For context on these market anxieties see the coverage on BoJ rate‑hike fears and their bearish implications for Bitcoin.
The mechanism matters: if a BoJ move induces global FX repositioning or forces yield normalization that competes with risk assets for investor capital, then even large spot demand (ETFs, treasurers, balance‑sheet buyers) can be offset by sellers or hedgers in derivatives markets who anticipate a higher liquidity premium.
Institutional spot‑ETF demand: real but not the whole story
ETF data and fund flows show that institutional interest is real — large buyers are still moving into Bitcoin as a portfolio allocation. AmbCrypto and other flow trackers document sizable purchases and an easing of heavy selling as big buyers step back in, which supports the bullish narrative that structural demand exists beneath the surface.
But inflows into spot ETFs tell only one part of the tale. ETFs bring buyers into the spot market, but they also create liquidity and opportunity for sophisticated players to execute offsetting strategies (derivative hedges, delta‑neutral structures, or simple option selling) that can mute raw price impact. The net effect of these layers can be a market that accumulates BTC on balance while still creeping sideways.
Derivatives, covered calls, and whale behavior that caps momentum
A key theme emerging from derivatives desks and analyst reports is that large holders are increasingly using covered‑call selling and other options strategies to extract yield and define ranges. CryptoNews notes that covered‑call selling by Bitcoin whales is weighing on spot prices — a practical manifestation of long holders monetizing gains while implicitly setting an upper bound on aggressive upside.
Covered calls work like this: an investor who owns spot BTC sells call options at a strike above the current price, collecting premium. If this is done at scale — and hedged or delta‑managed across large inventories — it creates a persistent supply of upside liquidity. Over time, that supply can compress realized upside and flatten rallies, particularly around strike clusters where sellers are concentrated.
Add to this the so‑called "OG strategies" discussed by market commentators: sophisticated, often opaque balance‑sheet plays that smooth realized volatility or cap momentum while maintaining exposure. These tactics may explain why ETF inflows coexist with a capped price. For a detailed opinion framing this dynamic, see the discussion on OG strategies potentially hurting Bitcoin's momentum.
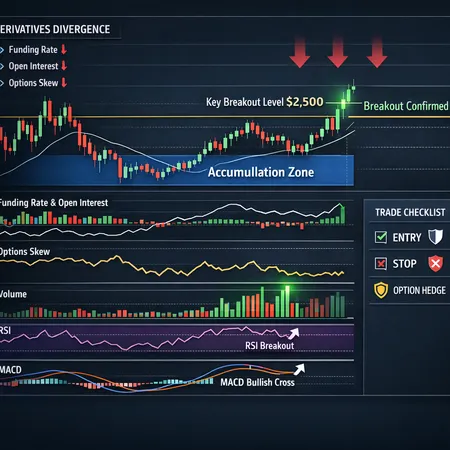
Signals and metrics to watch: breakout vs prolonged range
To be actionable, you need a watchlist of on‑chain, derivatives, and macro metrics that reveal whether the market is building energy for a breakout or tilting toward a long, sideways digestion.
- ETF net flows: sustained positive net flows for several weeks/months are necessary but not sufficient for a clean breakout. Look for accelerating daily flows combined with shrinking ETF creation/redemption spreads.
- Exchange reserves: falling exchange balances generally support higher prices; a stabilization or reversal in withdrawals can signal distribution. Monitor net inflows to top centralized exchanges.
- Futures open interest and funding rates: rising open interest with neutral or positive funding indicates conviction. Persistently negative funding or collapsing OI during a rally suggests short gamma/option‑selling pressure.
- Options skew and call‑put ratios: heavy call selling increases implied skew and introduces strike clusters. Watch for elevated OI at nearby strikes (e.g., $95k–$105k) and sustained put‑heavy flows that can be protective or bearish depending on context.
- Whale flows and covered‑call footprints: large wallets moving options premiums or systematic call writing onchain/within OTC desks is a red flag for capped upside. CryptoNews reporting on covered calls gives practical examples of this behavior.
- Macro inputs: real‑time rate expectations (JPY swap curves) and headline risk around central bank governance can move the market quickly. Cointelegraph's coverage of BoJ fears is a useful lens on how policy risk transmits.
- Exchange rate correlations and equity indices: if BTC starts to track a sharp move in global equities or a strengthening yen, expect higher correlation‑driven selling.
A credible breakout requires alignment: accelerating ETF buys, depleting exchange reserves, rising OI with positive funding, and waning options skew at upper strikes. Anything short of that risks a protracted chop.
Trading and portfolio tactics while the market digests macro events
For intermediate to advanced traders and allocators, the objective is to remain exposed to the structural bull case without being left vulnerable to a macro‑induced drawdown or to options‑driven range caps. Practical approaches:
- Layered entry and size discipline: average into positions across the band rather than all‑in near the lower edge. Use smaller tranches as price approaches the upper range to avoid selling into covered‑call liquidity.
- Put protection and collars: buy protective puts for asymmetric downside protection when macro risk is elevated, or sell covered calls against a portion of your position to monetize premium and offset put costs (collar).
- Dynamic hedging with futures: consider short‑dated, size‑limited futures shorts as tactical hedges around macro events (BoJ announcements, Fed leaks). Keep duration tight and roll if needed.
- Options selling with risk limits: if executing covered calls, size them to the portion of inventory you are comfortable being assigned and stagger strike levels to avoid concentrated strike clusters.
- Volatility carry and delta‑neutral plays: for advanced desks, delta‑hedged covered call or short VIX/vol carry strategies can capture premium — but watch for tail risk and gamma squeezes around macro surprises.
- Cross‑asset hedges: use relatively uncorrelated hedges (e.g., cash, short duration treasuries, or USD‑denominated instruments) when central bank policy risk spikes. Remember that tightening liquidity often hits risk assets broadly.
- Set clear stop and take‑profit rules: a breakout confirmation might be defined as a multi‑day close above $95k with falling exchange balances and supportive options flow. A breakdown could be a close below $85k with rising exchange inflows and negative funding.
Practical example: if you hold 10 BTC, you might protect 50% with an at‑the‑money to slightly out‑of‑the‑money put spread that costs 2–3% of position value, while monetizing 20% of your remaining exposure with staggered covered calls at $100k and $110k strikes. Tailor sizes to risk tolerance and liquidity needs.
Putting it together: probabilities, not certainties
The market is effectively in a tug‑of‑war: net ETF demand is supportive, but macro liquidity risk and systematic option selling by large holders are acting as a leash. That doesn't mean the bull market is dead; it means breakout timing is uncertain and likely conditioned on macro clarity and the unwinding or exhaustion of option‑selling stacks.
Watch the flow indicators outlined above and use staggered, hedged positioning rather than asymmetric, undisciplined exposure. For many allocators and traders using platforms like Bitlet.app, this regime calls for thoughtful execution, explicit hedges, and an eye on central bank headlines as much as crypto‑specific on‑chain metrics.
Sources
- BoJ rate‑hike fears and bearish implications for Bitcoin — Cointelegraph
- Covered‑call selling by Bitcoin whales weighing on spot prices — CryptoNews
- ETF flows and big buyers moving in after heavy losses — AMBCrypto
- Opinion on OG strategies capping Bitcoin momentum — CoinTribune
For many traders, Bitcoin remains the primary bellwether, and cross‑market dynamics seen on DeFi rails will continue to matter as ETFs and derivatives activity evolve.