Ethereum vs Solana: Is ETH's $3.4K Struggle a Temporary Lag or a True Flippening?
Summary
Executive snapshot
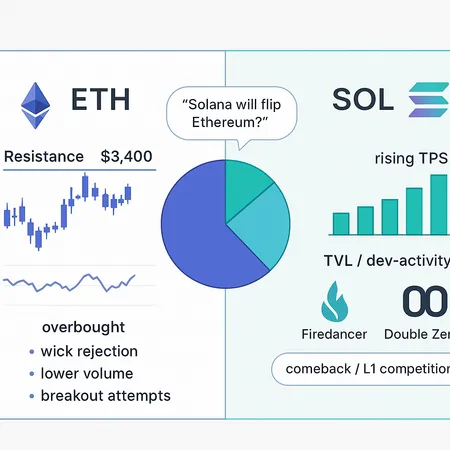
Ethereum has repeatedly tested the $3,400 area and failed to hold it as support, producing short‑term exhaustion signals even while broader crypto markets stage recoveries. At the same time, high‑throughput Layer‑1s like Solana have made visible infrastructure gains — most notably the Firedancer rollout — that rebalance risk/reward debates. This article lays out what the price action and on‑chain data are actually saying, which metrics should drive allocation decisions, and concrete trading/positioning takeaways for intermediate traders and portfolio managers.
ETH price action: the $3,400 leash and signs of exhaustion
The near‑term narrative for ETH is a classic resistance/retest story. Several attempts to break and hold the $3,400 zone have stalled; price has often reversed on elevated volume, suggesting supply remains abundant around that level. Short‑term indicators and technical commentaries highlight a failed test near $3,400 followed by exhaustion candles and skewed momentum — a pattern consistent with distribution rather than decisive accumulation. See a recent technical take noting a failed test of $3,400 and exhaustion signals for immediate trading relevance here.
At a broader timeframe, ETH has cut monthly losses and shown relative strength versus earlier drawdowns — it’s up versus deeper lows, but still lagging some of the wider market on a month‑to‑month basis. That nuance matters: short‑term traders must respect current resistance and exhaustion; longer‑term allocators can view the consolidation as a potential accumulation window if fundamentals hold. A price analysis noting ETH's recent breakout attempts and trailing position versus the broader market helps frame this intermediate outlook here.
Technical notes traders should bookmark
- Confirmed breakout: wait for daily close above $3,400 with higher-than-average volume and follow‑through the next 24–48 hours. That reduces false‑break risk.
- Failure scenario: rejection and a daily close back under $3,400 with lower lows targets the $3,000–3,100 area as the logical swing support.
- Momentum divergence: watch RSI and intraday orderflow for bearish divergence as early warning.
Solana's comeback: Firedancer, Double Zero and why infrastructure matters
Solana's narrative has shifted from 'unstable but fast' to 'improving reliability at scale.' The Firedancer mainnet improvements target throughput and validator performance, addressing prior uptime and congestion concerns. The Firedancer upgrade rollout is a material infrastructure datapoint that supports the argument Solana can sustainably service high‑throughput apps and users Firedancer mainnet details.
Paired with protocol‑level tweaks referred to in community discussions as "Double Zero" improvements — aimed at fee predictability and transaction flow — these upgrades tighten the gap between the promise of high TPS (transactions per second) and real, reliable delivery. For many market participants, the question is not speed alone; it’s whether speed comes with predictable finality, tooling for developers, and an ecosystem that captures real economic activity.
Headlines vs metrics: what actually determines a flippening?
Public figures and pundits make bold claims — "Solana will flip Ethereum" sells headlines — but durable market leadership is determined by measurable fundamentals. Consider four metrics that matter:
- TVL (Total Value Locked): a proxy for the economic activity secured by a chain and a leading indicator of DeFi utility.
- Developer activity: commits, GitHub activity, tooling maturity and SDK uptake signal long‑term innovation velocity.
- Sustained on‑chain throughput and uptime: not a one‑day TPS number but consistent throughput under load and low failure rates.
- Real active users and fee capture (including MEV): fee revenue and active addresses show whether economic value is flowing through the chain.
A single soundbite (or a celebrity prediction) can move flows short term, but structural rotation between major L1s requires persistent improvements across these metrics. Legal and idiosyncratic risk events — like high‑profile trials or fraud cases — can also distort sentiment and allocation; regulators and enforcement headlines matter because they change perceived tail risk (see contemporary coverage of major legal outcomes in the space) example coverage.
Internally, Ethereum still benefits from a massive composability moat, the L2 ecosystem, and established developer networks. For many traders and portfolio managers the real rivalry is less ETH vs SOL than: ETH + L2s vs high‑throughput L1s — a broader ecosystem competition that determines long‑term capital flows.
Comparing the data points: TVL, devs and throughput
- TVL: Ethereum retains a dominant TVL position in aggregate DeFi, though individual Solana apps can capture meaningful niches. Watch TVL trends quarter‑over‑quarter rather than absolute numbers; rapid, sustained inflows into Solana DeFi would support narrative re‑weighting.
- Developers: measure active repositories, releases, and dev grants adoption. If Solana's infrastructure upgrades translate to a steady rise in developer activity, that’s a signal of durable product‑market fit rather than a temporary rally.
- Throughput and fees: Firedancer improves the deliverable throughput, but the real test is whether throughput stays high under real usage while fees and MEV economics provide sufficient incentives to validators and builders.
These metrics are often noisy in the short run. Traders should combine technical price signals with on‑chain momentum (active addresses, new contracts deployed, validator growth) to decide whether to rotate exposure.
Practical trading and allocation takeaways
For intermediate traders and portfolio managers, here are actionable rules of engagement that balance conviction with risk control:
- Core‑satellite allocation
- Core: maintain a baseline ETH position as a long‑term structural holding (size depending on mandate). Ethereum's composability and L2 roadmap justify a sizable core.
- Satellite: allocate a smaller, tactical position to SOL to capture upside if Solana's infrastructure gains accelerate adoption. Size satellites to reflect higher idiosyncratic risk (e.g., 3–8% of crypto allocation).
- Event‑driven tactical plays
- Breakout confirmation: go long ETH on a confirmed daily close > $3,400 with volume and follow‑through. Use a trailing stop under a recent higher low.
- Rejection play: consider mean‑reversion trades if ETH is rejected hard at $3,400 — short with tight stops targeting $3,050–3,150, adjusting for volatility.
- Pair trades: express conviction by going long SOL/short ETH when on‑chain metrics (developer commits, TVL inflows, validator growth) show persistent divergence. Pair trades hedge market beta.
- Risk controls and timeframes
- Define clear timeframes: intraday scalps, swing setups (1–6 weeks), and structural allocations (months to years). Different timeframes require different sizing and stop logic.
- Use position sizing: never let a satellite bet exceed your pre‑agreed exposure cap; volatility in high‑throughput L1s can spike quickly.
- Monitor on‑chain signals weekly: active addresses, new contract deploys, TVL deltas and fee revenue trends.
- Watch the market structure
- Keep an eye on L2 adoption for Ethereum. L2 rollouts can blunt migration to L1s by matching user experience while preserving the security of Ethereum. For many portfolio managers, Ethereum + L2 exposure reduces the need for aggressive reallocations to other L1s.
A realistic framework for the next 3–12 months
- Bull case for ETH: successful retest and hold above $3,400, accelerating L2 activity, improved macro liquidity — expect ETH to reclaim leadership and compress relative volatility.
- Bull case for SOL: sustained on‑chain growth post‑Firedancer, increasing developer activity, and real economic throughput translating to fee capture — SOL could re‑rate as a high‑growth satellite.
- Flippening probability: low to medium in the near term. A true flip requires persistent metric convergence (TVL, devs, fees) over multiple quarters, not just a price move.
Final thoughts
Short‑term price behavior around $3,400 is actionable: respect breakout confirmations and exhaustion signals. Longer term, the competition between Ethereum and Solana is about ecosystem durability, not just TPS headlines. Evaluate allocations against measurable on‑chain metrics and use core‑satellite sizing to capture asymmetric upside while limiting idiosyncratic risk.
For traders looking for execution or installment options tied to cross‑chain strategies, platforms like Bitlet.app can be a piece of your operational toolset, but allocation decisions should remain grounded in the metrics and rules above.
Sources
- https://beincrypto.com/ethereum-price-breakout-7-percent-away-analysis/
- https://cryptopotato.com/ethereum-price-analysis-can-eth-challenge-3-4k-again-or-is-a-drop-below-3k-looming/
- https://www.newsbtc.com/altcoin/do-kwon-falls-hard-terraform-labs-chief-gets-15-years-for-wire-fraud/
- https://www.cryptopolitan.com/firedancer-upgrade-on-solana-main-net/