Why Bitcoin’s December 2025 Rally Is Tied to a Fed Rate Cut and Institutional Flows
Summary
Executive snapshot
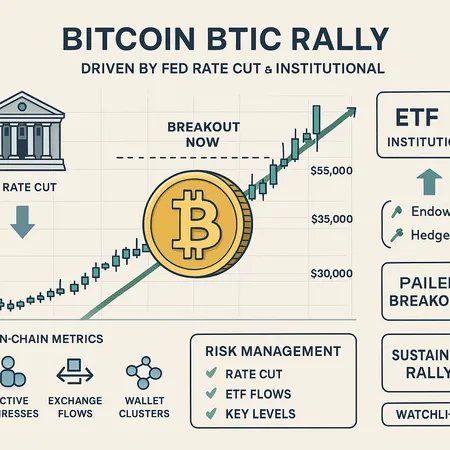
December 2025 has a clear market storyline: expectations of a Federal Reserve rate cut are tightening the macro backdrop while institutional demand — from spot ETFs to big allocators — is supplying the fuel. That combination can produce a powerful positive feedback loop for BTC price action, but it can also create crowded, fragile moves. This piece explains the mechanics, surveys the evidence, outlines key on‑chain and technical signals to monitor, and maps practical scenarios and risk management for intermediate traders and institutional allocators.
How a Fed rate cut feeds risk assets — and Bitcoin
A U.S. rate cut affects risk assets through a few well understood channels: lower policy rates reduce short‑term yields, push nominal and real yields down, ease borrowing costs and generally increase the present value of future returns. For markets reliant on yield differentials and carry — including equities, credit and crypto — the effect can be sizable.
- Lower real yields make non‑income assets like BTC relatively more attractive versus cash and bonds. Traders often rotate marginal capital into assets with asymmetric upside when the risk‑free rate falls.
- Reduced funding costs allow more leverage and easier capital deployment for hedge funds and macro allocators.
- The signals themselves matter: an announced or expected cut can change sentiment and encourage allocations ahead of the actual rate move.
Recent coverage highlights this link: markets have rebounded amid rate‑cut expectations and thinner macro risk (see reporting on the market rebound ahead of the expected cut) and analysts are already parsing near‑term catalysts into year‑end positioning Cryptopolitan. CoinDesk notes the market is pricing a 25bps Fed cut and shows how rising treasury yields still inject caution, underscoring that the macro story is nuanced and not guaranteed to be one‑way CoinDesk.
Why ETFs and institutional flows amplify the move
Spot Bitcoin ETFs create direct, on‑the‑ground demand for BTC. When managers receive investor money they typically buy spot BTC to match ETF exposure (or use a creation/redemption mechanism that results in net purchases). That mechanical demand can be swift and large, especially if inflows arrive daily. Institutional allocators — endowments, pensions and family offices — add another layer: when a university endowment or large allocator increases exposure, it tends to be long‑duration, adding structural demand rather than short‑term spec flows.
A vivid example of institutional demand is Harvard’s large increase in BTC exposure, which shows allocators are willing to hold sizeable, strategic positions in Bitcoin alongside traditional assets CryptoNews. Strategist narratives, like Tom Lee’s forecast for a new BTC high before January 2026, also influence positioning by shifting expectations among allocators and prop desks Zycrypto.
Combine the expected Fed cut (which relaxes financing conditions) with continuing ETF creations and institutional allocations and you have a potentially durable bid — but only if inflows persist and market structure (liquidity, funding, futures basis) supports follow‑through.
Spot ETF flow signals and what they tell you
Watch these ETF‑related indicators closely:
- Daily net inflows/outflows into spot ETFs: persistent inflows are proof of demand that translates to spot purchases; rapid outflows can reverse that mechanical buying.
- ETF AUM growth rate and creation/redemption activity: large creations indicate manager buying; redemptions are the opposite.
- Premium/discount to NAV (where applicable) and secondary market liquidity: widening premiums can signal robust demand relative to supply.
These flow signals — when combined with macro cues — provide a live read on whether institutional demand is decking in or simply sniffing around. The media narrative about a year‑end ‘Santa rally’ and technical catalysts has been building Cointelegraph, and traders should treat ETF flow continuity as the difference between a mechanically‑sustained rally and a sentiment‑driven pop.
On‑chain metrics that confirm real accumulation
On‑chain signals are especially valuable because they show where supply is moving — not just what price action implies. Key metrics to monitor:
- Exchange net flows (exchanges to wallets): sustained withdrawals lower sell‑side liquidity and support higher prices; inflows suggest potential distribution.
- Realized cap and MVRV Z‑score: rising realized cap with increasing MVRV indicates profits are being realized but not necessarily widely distributed.
- SOPR (Spent Output Profit Ratio): values above 1.0 indicate on‑chain transactions are generally in profit; a falling SOPR during price rises can indicate long‑term holders are not selling.
- Coin age / coin days destroyed: high coin days destroyed on distributions signals long‑term holder selling.
- Whale accumulation metrics (addresses holding large BTC buckets): growing balances in large addresses can show institutional or early investor accumulation.
- Futures basis and funding rates: a positive and widening basis (spot higher than futures) suggests strong immediate demand for physical BTC; negative funding with rising spot is a divergence to watch.
Tracking these metrics lets you answer the crucial question: are flows creating structural demand (withdrawals from exchanges, increasing long‑term accumulation) or is price being pushed up by transient leverage and short squeezes?
Technical price levels and market structure to watch
Rather than pinning absolute price targets, intermediate traders should monitor technical structure anchored to the current trend and recent cycle highs/lows: moving averages, prior resistance zones, liquidity clusters and momentum indicators.
Practical levels and signals:
- Moving averages: daily 50‑ and 200‑day MA crossovers and price action relative to them give context on trend strength.
- Prior cycle highs and psychological round numbers: these commonly act as resistance and magnet points for take‑profit orders.
- Volume profile and liquidity nodes: heavy executed volume zones can flip from resistance to support once cleared.
- RSI and MACD momentum validation: sustained rallies accompanied by rising momentum are healthier than rallies on waning momentum.
- Futures open interest and liquidation levels: sudden spikes in long liquidations can trigger sharp pullbacks.
If the breakout is real, you'd expect increasing volume on breakouts, falling exchange reserves, positive futures basis and improving on‑chain accumulation metrics. If it's fake, you may see weak volume, return of coins to exchanges, compressed basis and negative divergences on momentum.
Scenario planning: failed breakout vs sustained rally
Scenario A — Sustained rally (bull case):
- Macro: Fed signals a 25bps cut (or strong market certainty of it), treasury yields stabilize or fall.
- Flows: consistent spot ETF inflows and continued withdrawals from exchanges.
- On‑chain & derivatives: positive basis, consistent funding, declining exchange reserves, rising whale accumulation.
- Technical: clean breakout above prior resistance with volume confirmation and momentum support.
- Result: a multi‑week extension where allocators scale into positions, volatility calms, and risk assets outperform.
Scenario B — Failed breakout (bear/take‑profit case):
- Macro: treasury yields rise or the Fed narrative weakens; markets price a delayed or smaller cut.
- Flows: inflows dry up or reverse; spot ETF creations stall.
- On‑chain & derivatives: coins return to exchanges, negative funding or flattening basis, muted withdrawals.
- Technical: rejection at resistance, high intraday volume on down moves, spike in long liquidations.
- Result: a rapid retracement as short‑term buyers get stopped out and longer holders wait to re‑accumulate at lower prices.
Mapping playbook to scenarios: if macro and flow indicators align with the bull case, maintain or scale long exposure with trailing risk controls. If indicators flip toward the failed breakout scenario, reduce exposure, tighten stops, and consider hedges.
Actionable risk management for traders and allocators
Practical rules you can implement before and during the Fed decision window:
- Position sizing: limit single‑trade exposure to a fixed percent of portfolio (e.g., 1–3% for tactical trades; higher for strategic allocations but with longer time horizons).
- Reduce leverage around macro catalysts: volatility around the Fed decision can create rapid, liquidity‑draining moves.
- Staged entry / laddering: scale into size across several price points or on confirmed flow signals (sustained ETF inflows, falling exchange reserves).
- Use options to hedge: buying put protection or constructing collars can cap downside while keeping upside exposure; monitor implied volatility and skew costs.
- Stop placement: use technical stops outside key liquidity clusters rather than tight volatility stops that trigger in normal noise.
- Portfolio rebalancing rules: set rules for when to take profits (e.g., pro‑rated profit taking at predetermined levels) and when to add on confirmed accumulation signals.
- Watch liquidity and slippage: large orders in thinly liquid windows can move markets; split execution and use TWAP/VWAP where appropriate.
For institutional allocators: document investment policy exceptions for crypto allocations, set clear custody and liquidity requirements, and ensure a plan for rapid deleveraging if macro risk flips unexpectedly. Tools like Bitlet.app can help execute and manage recurring buys or structured entries as part of a disciplined allocation program.
What to watch next — checklist for traders
- Fed communications and the official rate decision date/time: the primary macro trigger.
- Treasury yields (2y and 10y): persistent rises will undermine a risk‑on move even if the Fed cuts.
- Daily spot ETF inflows and creation/redemption notes: sustained weekly inflows are bullish.
- Exchange reserves and net outflows: steady withdrawals support a structural bid.
- Futures basis and funding rates: positive basis and neutral/positive funding confirm physical demand.
- Options skew and put/call ratios: an aggressive bid for puts can show hedging demand or fear.
- On‑chain metrics: SOPR, MVRV Z, coin days destroyed, and whale accumulation trends.
- Technical confirmations: volume on breakout, moving average behavior, and liquidity clusters around prior highs.
Final thoughts
A Fed rate cut can be the macro spark that lowers the cost of carry and nudges capital toward risk assets, but the sustainability of Bitcoin’s December 2025 rally depends on whether spot ETF flows and institutional allocations translate that macro tailwind into real, lasting demand. Traders and allocators should use a blended approach: macro cues to time the higher‑level bias, ETF and on‑chain metrics to confirm the durability of buying, and disciplined risk management to survive a potential shakeout. Keep your checklist handy, limit leverage, and favor scalable entries over headline chasing. For execution and recurring buy strategies, platforms like Bitlet.app can help implement disciplined plans without emotional timing errors.