XRP Ledger Velocity Spike: What It Means for Price, ETFs, and Liquid Staking
Summary
Executive overview
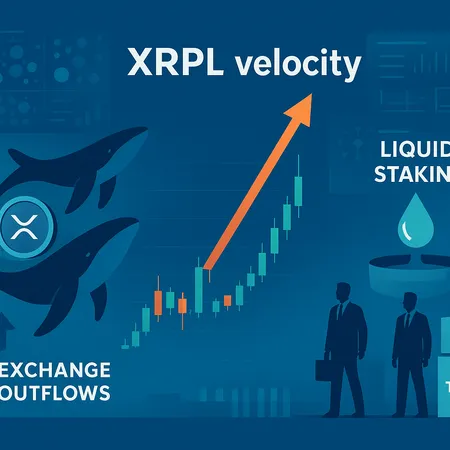
The XRP Ledger (XRPL) recently registered a record on‑chain velocity spike — a metric that tracks how quickly units of XRP circulate between addresses. That jump isn’t just noise: on‑chain analytics show a mix of concentrated whale activity, a new wave of liquid staking product flows, and steady exchange outflows consistent with institutional accumulation and ETF demand. In short: liquidity dynamics are shifting, and price action may follow when technical resistance gives way.
This article lays out the on‑chain evidence, explains how product launches and ETFs are interacting with liquidity, highlights the technical levels to watch (including the critical resistance near $2.28), and provides concrete scenario plans for traders and allocators.
What the on‑chain metrics are telling us
Two independent data points captured the XRPL velocity story this week. CryptoQuant‑derived coverage, highlighted by Finbold, shows XRPL circulation velocity hitting its highest 2025 levels; that corroborates reporting from Cryptopolitan, which ties the spike to clustered whale transfers and inflows into a newly announced liquid staking platform for XRP. See the raw reporting for the velocity spike and product links here and here.
Why velocity matters: when the same tokens move through multiple hands quickly, it suggests either increased speculative turnover, heightened settlement activity behind a product (like staking or lending), or coordinated transfers by large holders. Velocity alone doesn’t equal price direction, but it does reveal where liquidity is moving — a necessary input for execution decisions.
Whale clusters and labeling
On‑chain clustering shows several large XRP transfers routing between a handful of cold wallets and staging addresses in short succession. These patterns often precede distribution events or accumulation ahead of product launches. Cryptopolitan links the spike to identifiable whale activity and early staking flows, a signal that the same liquidity pools are being repurposed rather than dispersed broadly.
Liquid staking: new product dynamics
A recent liquid staking product for XRP has begun to surface in on‑chain flows and reporting. Liquid staking changes the liquidity profile of an asset: it locks underlying tokens into protocol contracts while issuing transferable derivatives that reintroduce circulating liquidity in a different form. In practice:
- Some XRPL gets locked into the staking contract (reducing float), while derivative tokens may be traded, used as collateral, or staked elsewhere (recycling liquidity).
- The timing of derivative issuance and secondary‑market trades can spike velocity as the same economic exposure moves between addresses.
This product cohort is a plausible cause for part of the velocity uptick — and it also creates a structural narrative: if staking derivatives scale, a portion of exchange float can remain off‑market, tightening immediate liquidity and increasing price sensitivity to large buy/sell orders.
Exchange outflows, ETF demand, and institutional flows
Multiple reports connect the exchange outflows to rising spot ETF demand and institutional accumulation. Finbold notes CryptoQuant data showing meaningful exchange withdrawals; DailyCoin frames those outflows within the ETF narrative, arguing that near‑term ETF cap milestones and buyer demand have pulled significant XRPL off exchanges.
When exchange balances decline, the on‑exchange liquidity available to absorb market orders shrinks. Combine that with whale accumulation and you have a system primed for larger price moves on relatively modest net flows. That’s not a guarantee of higher prices — concentrated selling can trigger similar dynamics — but it does raise the stakes.
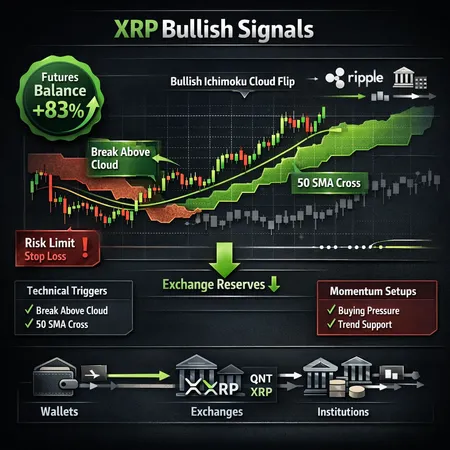
Price context and technical hurdles
Price action has already reacted: market commentary observed a rebound above $2, and analysts have flagged a key resistance zone near $2.28 that would determine whether on‑chain momentum converts into a broader breakout. NewsBTC provided an overview of the recent technical rebound, while CryptoPotato drilled into the $2.28 resistance as a structural pivot.
Key levels to watch (price may vary slightly by exchange):
- Immediate support: recent short‑term consolidation range (near prior daily open and local VWAP).
- Mid resistance: $2.00 — psychological and where momentum tests have clustered.
- Critical resistance: ~$2.28 — a supply band identified by multiple technical analysts. A clean daily close above this level would materially increase breakout probabilities.
Technicals matter more when liquidity is tight. With fewer tokens on exchange and whales holding concentrated positions, a rejection at $2.28 could cascade quickly if a large holder decides to harvest gains.
Practical scenarios and execution plans
Below are staged scenarios for intermediate/advanced traders and portfolio managers, framed by on‑chain signals.
Scenario A — Bull continuation (high probability if ETF flows persist):
- Trigger: sustained exchange outflows + daily close above $2.28 with rising on‑chain velocity and low realized volatility on derivatives.
- Action for traders: favor momentum entries on pullbacks to the breakout zone; use tight, structural stops below $2.00 or the relevant local structure; size for slippage given thin exchange depth.
- Action for allocators: tranche institutional buys using TWAP or POV execution to avoid front‑running whales; consider using derivatives to hedge execution risk during accumulation.
Scenario B — False breakout and liquidity squeeze:
- Trigger: velocity spike coincides with a failed test of $2.28, followed by sudden exchange inflows (whales dumping to exchanges).
- Action for traders: watch on‑chain whale transfers and exchange balance upticks; switch to market‑neutral or short strategies once orderbooks show replenished ask liquidity. Tight risk controls critical — spikes can form whip‑saws.
- Action for allocators: pause new buys; use rebalancing windows to sell into strength if reallocation mandates require it.
Scenario C — Range extension with new derivative liquidity:
- Trigger: liquid staking adoption grows, derivatives trade actively while underlying XRPL stays locked — velocity remains high but price grinds.
- Action for traders: employ range strategies and options income (if liquid); capture yield from staking derivatives but hedge spot exposure appropriately.
- Action for allocators: assess whether staking yields plus derivative liquidity materially change long‑term allocation thesis; model the impact of reduced circulating float on portfolio liquidity.
Signals to monitor in real time
Prioritize these on‑chain and market indicators to update probability estimates:
- XRPL velocity (watch for sustained elevation vs. one‑off spikes).
- Exchange balances and flows (Net inflows/outflows over 24–72h).
- Whale clustering and tagged addresses (large transfers to/from cold wallets or staking contracts).
- Derivative issuance and volume from the new liquid staking product (on‑chain and AMM/DEX volumes).
- Orderbook depth around $2.00–$2.30 and futures/derivative open interest changes.
Combine these with macro/market cues: ETF filings, regulatory headlines, and broad crypto risk sentiment. For more on on‑chain indicators, specialized platforms and reports can be invaluable when timing big trades — and platforms like Bitlet.app can be a practical venue to think about execution and allocation strategies in crypto portfolios.
Risk management and sizing
When liquidity is the dominant variable, size matters. A small allocation error can multiply into outsized slippage costs.
- Use execution algorithms (TWAP/POV) for >1% of daily volume buys or sells.
- Set explicit slippage and market impact limits in pre‑trade checks.
- Consider dynamic sizing: increase participation when on‑chain velocity normalizes and exchange liquidity deepens; decrease when whale clustering is highest.
Remember: on‑chain momentum can reverse quickly when a few addresses control a meaningful share of the float.
Conclusion — a conditional edge, not a certainty
The XRPL velocity spike is meaningful because it bundles three things: concentrated whale movement, fresh liquidity engineering via liquid staking, and exchange outflows consistent with ETF/institutional demand. Together they compress available liquidity and increase the market’s sensitivity to large orders.
That creates opportunity — but also risk. A clean break above the $2.28 resistance with corroborating on‑chain signals would be a high‑probability bullish event; conversely, a failed breakout could produce an outsized retracement. Traders should execute with slippage awareness and allocators should plan tranche buys keyed to on‑chain confirmations.
Sources
- XRP spikes—record‑breaking on‑chain velocity and whale activity report
- Finbold — XRPL circulation velocity hits 2025 high (CryptoQuant data)
- NewsBTC — XRP price commentary and technical context
- DailyCoin — XRP accumulation and ETF cap analysis
- CryptoPotato — Key resistance details for Ripple’s XRP breakout
For more onchain reads and tag exploration see XRP and how derivative narratives are reshaping DeFi.