PEPE Breakdown as a Risk-Management Case Study: Rules for Trading High‑Beta Meme Coins
Summary
Why PEPE's breakdown matters: a short primer
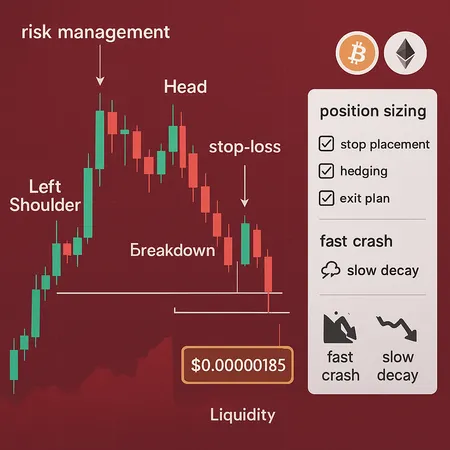
PEPE recently completed a classic head‑and‑shoulders breakdown with a Fibonacci downside projection near 0.00000185, a technical call detailed in contemporary coverage. That pattern is useful beyond one coin — it shows how structural technical failure in a low‑liquidity token can cascade when the market lacks breadth and depth.
This matters now because the broader crypto market is operating under elevated stress. Since the October 10 drawdown, institutional portfolios have been under strain and volatility has stayed high, which can amplify price moves for speculative, low‑cap assets. ETF flows have not been steady either: meaningful outflows can remove system liquidity and increase the chance of sharp, disorderly moves in memecoins.
The technical anatomy: PEPE's head‑and‑shoulders and the Fibonacci target
A head‑and‑shoulders top contains three peaks: a left shoulder, a higher head, and a right shoulder that fails to reach the head; the neckline connects the lows between these peaks. Once price decisively breaks the neckline on volume, the measured move projection is typically the head‑to‑neck distance projected downward.
In PEPE's case, analysts observed that the neckline break coincided with momentum confirmation and a Fibonacci projection aligned near 0.00000185 — a confluence that strengthens the downside target relative to a raw measured‑move alone (see the technical breakdown coverage for specifics). Using Fibonacci levels as a secondary reference is common: when a pattern projection and a Fibonacci extension concur, it raises the probability of the level acting as a magnet in a trending selloff.
But two caveats matter for traders: first, low‑liquidity tickers often overshoot or undershoot technical targets because order books are thin; second, price discovery in meme coins is heavily path‑dependent — i.e., the speed of the move changes risk management choices.
Macro backdrop: why ETF outflows and BTC/ETH stress amplify meme downside
Macro liquidity matters. When large pools of capital withdraw — for example, through ETF outflows — the market loses passive buyers that would otherwise absorb sell pressure. Reporting shows that Bitcoin‑focused ETFs experienced notable weekly outflows in a recent week, a dynamic that can reduce available liquidity and transmit stress to smaller tokens.
Similarly, institutional portfolio pain after major draws (notably since October 10) forces deleveraging, margin calls, and rebalancing. When BTC and ETH draw down, correlated holdings — especially speculative meme coins like PEPE — often suffer disproportionately because they sit at the tail of the liquidity curve. For a concise market snapshot, see the coverage on institutional strains since October and the ETF outflow analysis.
Mechanically, the risk channel works like this: ETF outflows and BTC/ETH sell pressure reduce overall liquidity; reduced liquidity magnifies price impact for memecoins; larger impact triggers more stop‑losses and margin liquidations; and that feedback loop worsens the drawdown.
Translating the case study into risk‑management rules
Below are practical, actionable controls designed for active retail traders and short‑term fund managers trading memecoins.
1) Position sizing: keep exposure bounded and volatility‑aware
- Hard cap: limit any single memecoin position to a small fraction of total capital. For most active retail traders, 0.5–2% of portfolio value per trade is a conservative range. Short‑term funds may extend to 3–5% only with systematic hedging.
- Volatility‑adjusted sizing: use risk per trade = target portfolio risk * (portfolio value) and size = risk per trade / (entry price − stop price). Example: if you tolerate 0.5% portfolio risk on a $100,000 account ($500 risk) and your stop is placed 50% below entry on a volatile meme coin, your position would be $1,000 notional (because $1,000 × 50% = $500). This prevents oversized bets driven by headline returns.
- Diversify memecoin exposure: cap total memecoin allocation (sum of all memecoin positions) at something like 5–10% of portfolio value to avoid single‑style concentration.
2) Stop placement: layered stops, not one‑size‑fits‑all
- Tactical stop (liquidity stop): a tight stop to protect against flash declines — e.g., 20–40% below entry for very volatile memecoins. This is a speed control, not a market view.
- Structural stop (pattern invalidation): place a higher, strategic stop tied to technical invalidation points — for a head‑and‑shoulders short, that would be above the right shoulder or above a confirmed breakout retest. If the pattern invalidates, the trade thesis fails.
- Use both: implement the tactical stop as an immediate defensive order and the structural stop as an action plan if the market signals a regime shift (e.g., move price back above the right shoulder). Avoid the temptation to widen tactical stops because memecoin volatility is 'normal' — you still must limit absolute dollar risk.
- Beware of market orders in illiquid moments: slippage can turn a well‑sized trade into a catastrophic loss. Use limit orders where practical and staggered exits if the order book is thin.
3) Portfolio hedging: reduce systemic exposure, not idiosyncratic poker
- Correlation hedge: buy protection on Bitcoin or Ethereum if memecoins are moving with major caps. Options (puts) on BTC/ETH or short futures reduce the portfolio’s macro beta.
- Tail hedges: allocate a small, explicit budget (e.g., 0.25–0.5% of portfolio) to tail‑risk options or inverse products that pay off during violent market drops. Think of this as insurance, not alpha.
- Cash buffers and stablecoin liquidity: keep some dry powder in stablecoins to buy dips or reduce the need to liquidate positions into illiquidity.
- Synthetic pair hedges: for funds with tools, short a correlated memecoin index or trade derivatives that offer broader exposure instead of trying to short a single, extremely illiquid token.
4) Exit plans: predefine scale points and market conditions
- Scale‑out points: define partial exit levels (e.g., 25%, 50%, 25%) at meaningful technical levels — first at nearby support, then at the Fibonacci/pattern target, and the remainder on further confirmed weakness.
- Liquidity contingency: if market depth collapses, switch to time‑weighted exits (sell in slices over minutes/hours) to capture better average prices.
- Emotional discipline: commit to execution rules ahead of time — avoid “hope sells” where you hold past your stop because you believe fundamentals will change.
Scenario planning: fast crash vs slow decay
Different market speeds require different tactics.
Fast crash (minutes–hours): prioritize capital preservation. Use tactical stops and allow for partial loss realization; do not attempt to catch the absolute bottom. If liquidity evaporates, reduce position size and report impact. A pre‑funded hedge (puts or inverse futures) is the most effective tool here.
Slow decay (days–weeks): more time to react. Use measured scaling out, tighten structural stops as support fails, and redeploy capital into higher‑probability trades. Reassess correlations: if BTC/ETH continue to weaken, raise hedges and trim speculative exposure progressively.
For PEPE’s head‑and‑shoulders breakdown, a fast crash would likely push price through the Fibonacci target quickly, while a slow decay would mean multiple support retests around intermediate Fibonacci levels. Plan exits and hedges for both.
Off‑ramp checklist (quick reference)
- Pre‑trade: define max position (% of portfolio), absolute dollar risk, and two stop levels (tactical + structural).
- Upon entry: place tactical stop order; log thesis (why this trade, what invalidates it, target levels such as the Fibonacci target near 0.00000185 for PEPE).
- If market liquidity falls: switch to limit orders, staggered fills, or reduce order size; avoid sweeping the order book.
- If structural invalidation occurs: exit to predetermined stop or cover hedges and reassess the thesis.
- If target hit or partial exit reached: scale out as planned; rebalance portfolio risk allocation.
- Post‑trade: record execution metrics (slippage, time to fill, realized loss/gain) and update rules based on lessons learned.
Practical example: sizing and stop for a PEPE trade
Assume $50,000 account, willing to risk 0.5% ($250) on a single PEPE trade. Entry = 0.00000300, tactical stop = 30% below entry (0.00000210). Position size = $250 / (0.00000300 − 0.00000210) = $250 / 0.00000090 ≈ 277,778 PEPE tokens (notional ≈ $833 at entry). This keeps loss contained while reflecting token volatility. The structural stop could be set above the right shoulder; if that invalidates, close remainder of position regardless of tactical stop.
Final thoughts — rules beat hope
PEPE's technical breakdown and the Fibonacci target near 0.00000185 are a timely reminder that memecoin trading combines technical pattern risk with macro liquidity risk. When ETF flows turn negative and BTC/ETH draw down, memecoins can become highly path‑dependent and brutal.
The antidote is not perfect prediction but structured risk controls: disciplined sizing, layered stops tied to both liquidity and technical invalidation, conservative hedging of macro beta, and scenario‑specific exit planning. For traders using platforms and features like those on Bitlet.app, fold these rules into your execution workflows and record every trade against your checklist so you learn systematically rather than react emotionally.